| Red | Green | Blue | |
| z | 17.64 | ||
| znorm | Inf | ||
| sky | -Inf | -Inf | -NaN |
| S/N | 20.7 | 38.9 | 39.7 |
| S/N(c) | 0.0 | 0.0 | 0.0 |
| SN(E/C) |
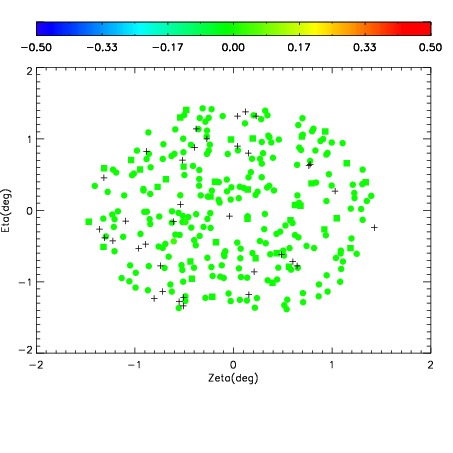

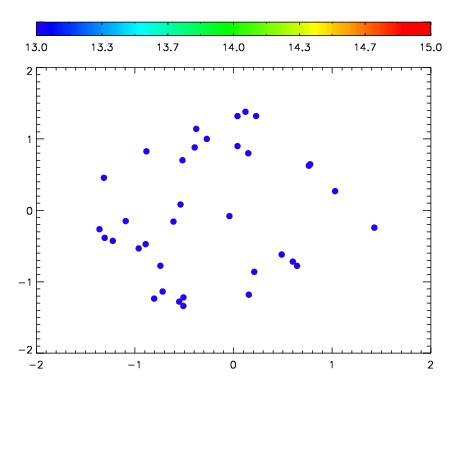

| Frame | Nreads | Zeropoints | Mag plots | Spatial mag deviation | Spatial sky 16325A emission deviations (filled: sky, open: star) | Spatial sky continuum emission | Spatial sky telluric CO2 absorption deviations (filled: H < 10) | |||||||||||||||||||||||
| 0 | 0 |
|
|
|
|
|
|
| IPAIR | NAME | SHIFT | NEWSHIFT | S/N | NAME | SHIFT | NEWSHIFT | S/N |
| 0 | 15590028 | 0.488096 | 0.00000 | 18.2532 | 15590029 | -0.000347849 | 0.488444 | 18.2649 |
| 1 | 15590027 | 0.487339 | 0.000757009 | 18.7035 | 15590026 | 0.000579089 | 0.487517 | 18.7011 |
| 2 | 15590032 | 0.487051 | 0.00104499 | 18.5767 | 15590033 | 0.000252068 | 0.487844 | 18.6117 |
| 3 | 15590031 | 0.487479 | 0.000616997 | 18.1216 | 15590030 | 0.000340431 | 0.487756 | 18.1357 |
| 4 | 15590023 | 0.487690 | 0.000405997 | 18.0180 | 15590022 | 0.00000 | 0.488096 | 18.0856 |
| 5 | 15590024 | 0.487993 | 0.000102997 | 17.9178 | 15590025 | 0.00165901 | 0.486437 | 17.9249 |