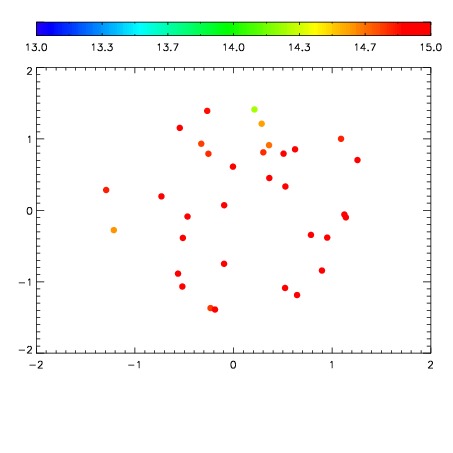
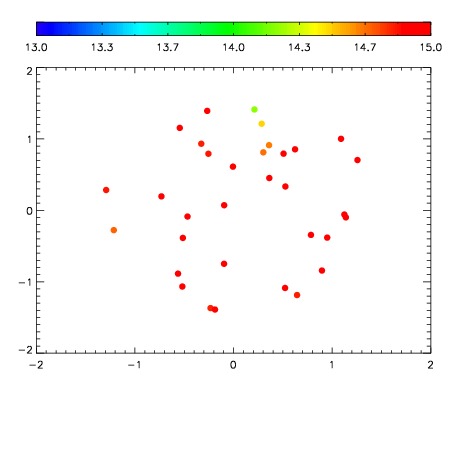
| Frame | Nreads | Zeropoints | Mag plots
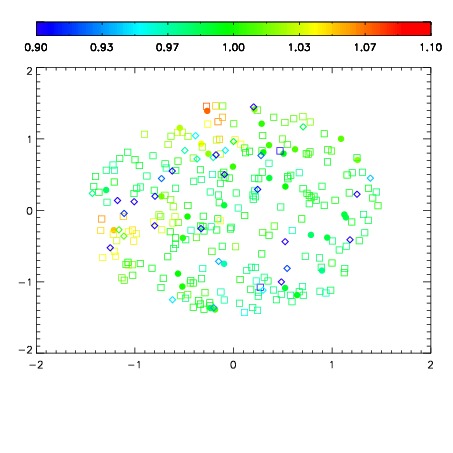
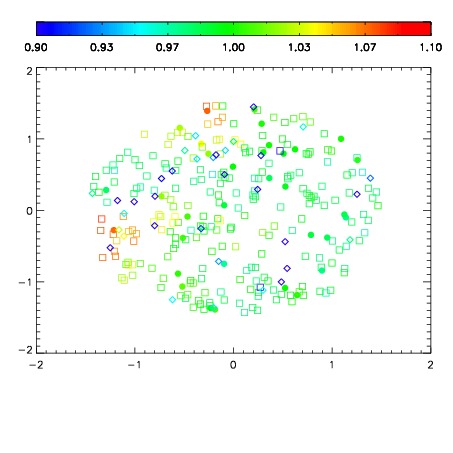
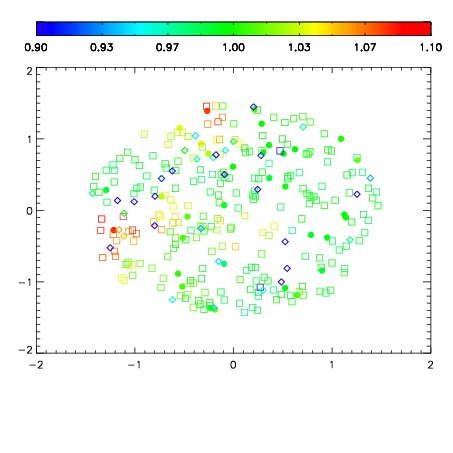
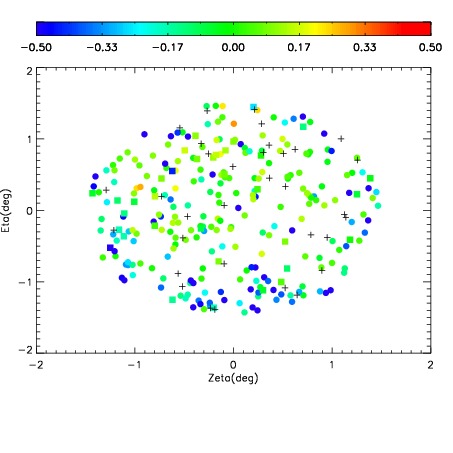
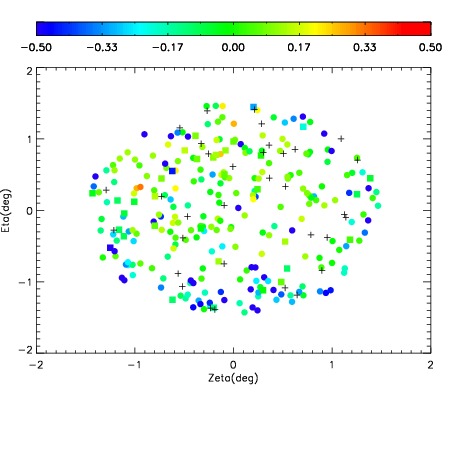
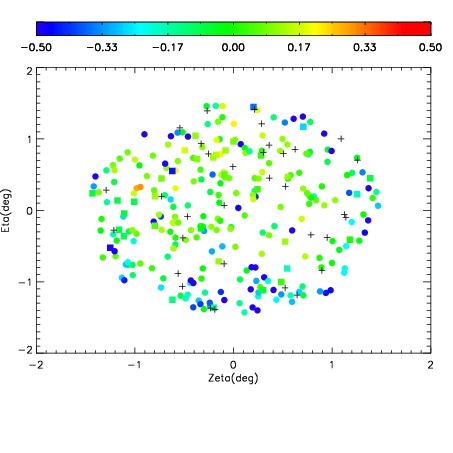
| Spatial mag deviation
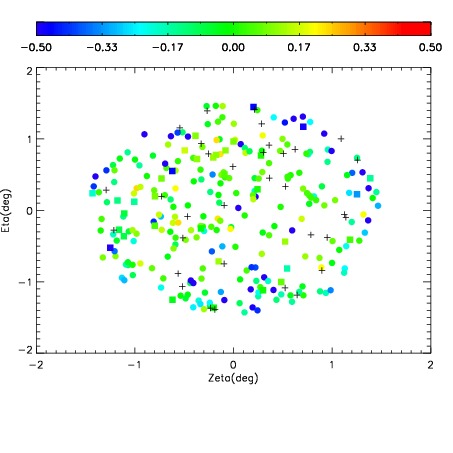
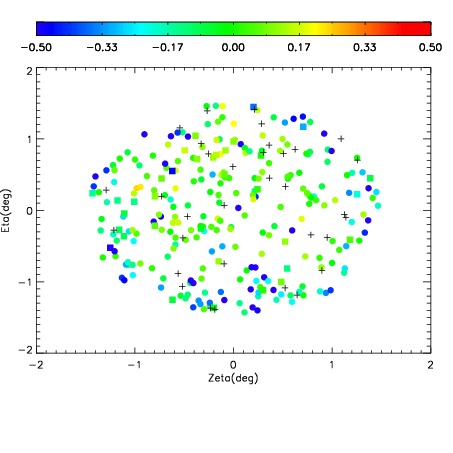
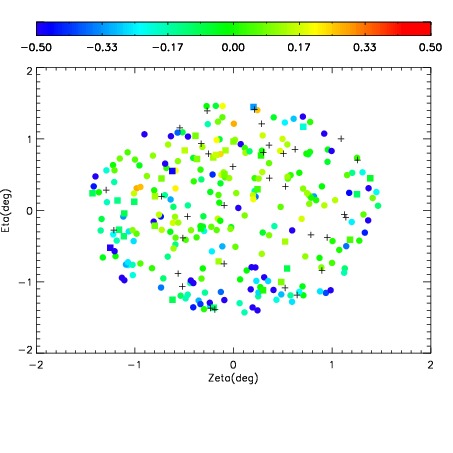
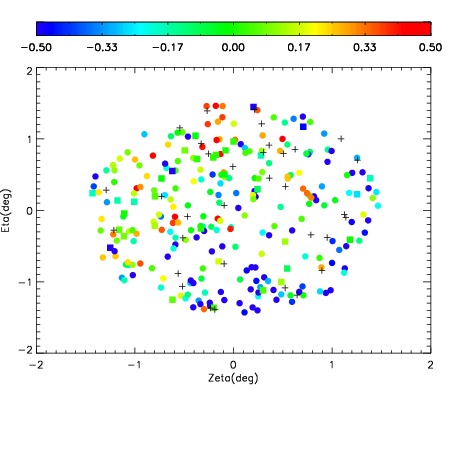
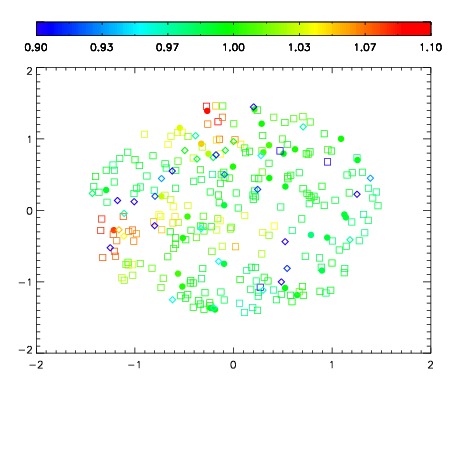
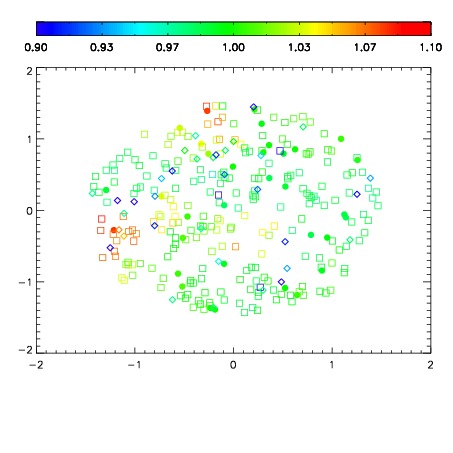
| Spatial sky 16325A emission deviations (filled: sky, open: star)
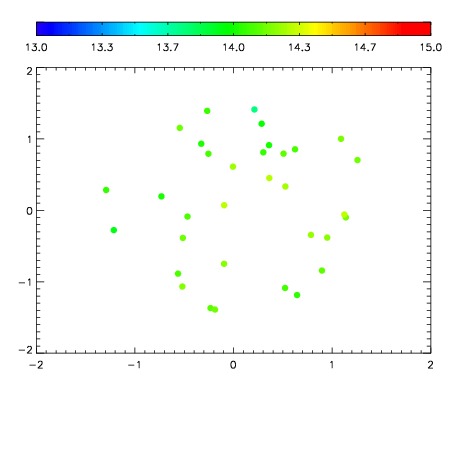
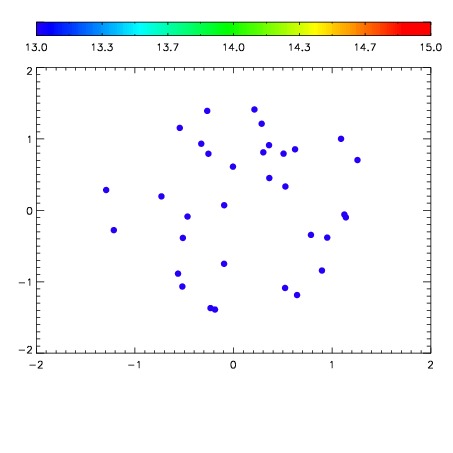
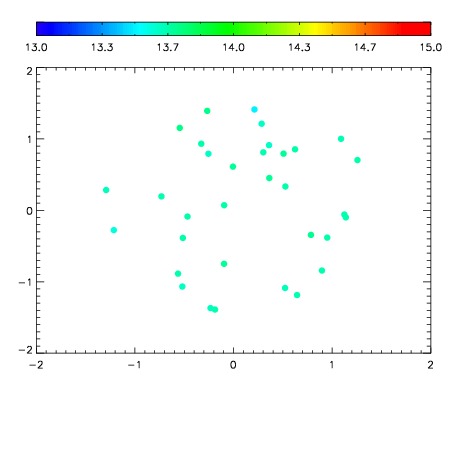
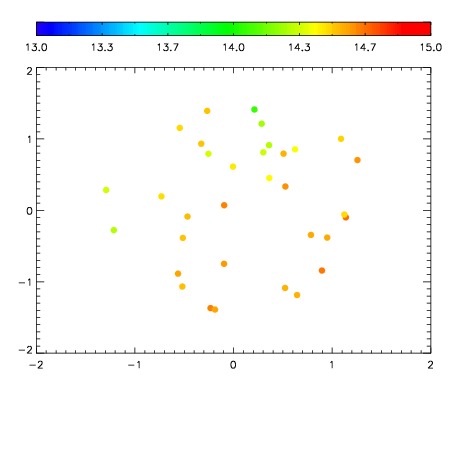
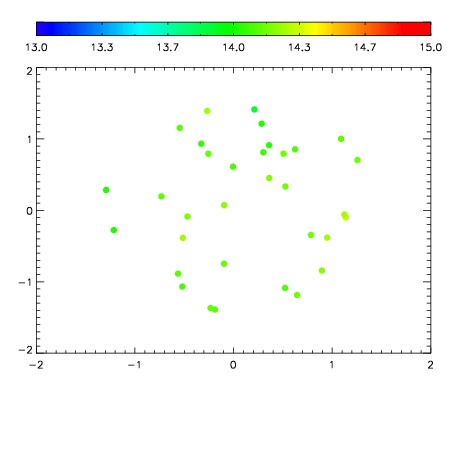
| Spatial sky continuum emission
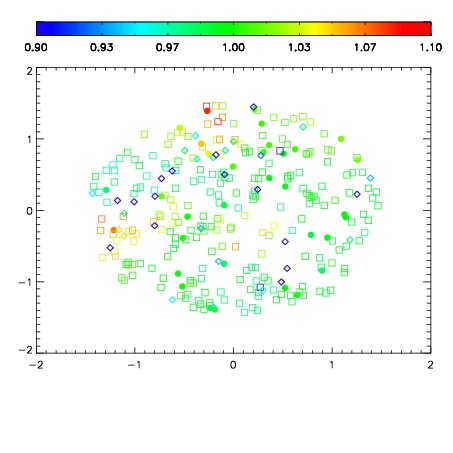
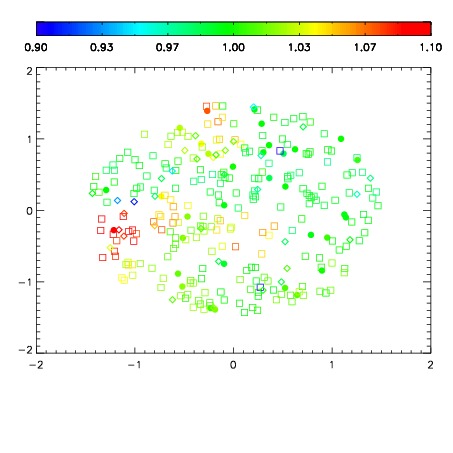
| Spatial sky telluric CO2 absorption deviations (filled: H < 10)
|
| 14950068
| 47
| | Red | Green | Blue
| | z | | 18.90
| | znorm | | 14.72
| | sky | 14.4 | 14.1 | 14.4
| | S/N | 16.8 | 24.1 | 29.6
| | S/N(c) | 15.7 | 35.6 | 27.8
| | SN(E/C) 0.40
|
| 
| 
| 
| 
| 
|
| 14950069
| 47
| | Red | Green | Blue
| | z | | 19.14
| | znorm | | 14.96
| | sky | 15.1 | 14.9 | 15.1
| | S/N | 18.9 | 27.5 | 33.3
| | S/N(c) | 17.7 | 40.0 | 30.9
| | SN(E/C) 0.34
|
| 
| 
| 
| 
| 
|
| 14950070
| 47
| | Red | Green | Blue
| | z | | 19.14
| | znorm | | 14.96
| | sky | 15.1 | 14.9 | 15.2
| | S/N | 18.6 | 27.4 | 33.0
| | S/N(c) | 17.6 | 40.0 | 30.6
| | SN(E/C) 0.33
|
| 
| 
| 
| 
| 
|
| 14950071
| 47
| | Red | Green | Blue
| | z | | 19.11
| | znorm | | 14.93
| | sky | 15.3 | 15.0 | 15.2
| | S/N | 18.3 | 27.1 | 32.5
| | S/N(c) | 17.3 | 39.6 | 30.3
| | SN(E/C) 0.35
|
| 
| 
| 
| 
| 
|
| 14950072
| 47
| | Red | Green | Blue
| | z | | 16.84
| | znorm | | 12.66
| | sky | 12.9 | 12.9 | 13.1
| | S/N | 3.6 | 6.9 | 7.8
| | S/N(c) | 4.0 | 11.3 | 8.4
| | SN(E/C) 0.84
|
| 
| 
| 
| 
| 
|
| 14950073
| 47
| | Red | Green | Blue
| | z | | 18.58
| | znorm | | 14.40
| | sky | 13.8 | 13.7 | 13.7
| | S/N | 12.7 | 19.6 | 23.5
| | S/N(c) | 12.8 | 30.2 | 22.8
| | SN(E/C) 0.41
|
| 
| 
| 
| 
| 
|
| 14950074
| 47
| | Red | Green | Blue
| | z | | 18.98
| | znorm | | 14.80
| | sky | 14.5 | 14.5 | 14.5
| | S/N | 17.2 | 25.1 | 30.4
| | S/N(c) | 16.2 | 37.0 | 28.5
| | SN(E/C) 0.37
|
| 
| 
| 
| 
| 
|
| 14950075
| 47
| | Red | Green | Blue
| | z | | 18.80
| | znorm | | 14.62
| | sky | 14.1 | 14.1 | 14.2
| | S/N | 15.2 | 22.3 | 27.1
| | S/N(c) | 14.7 | 33.7 | 26.1
| | SN(E/C) 0.39
|
| 
| 
| 
| 
| 
|