| Red | Green | Blue | |
| z | 17.64 | ||
| znorm | Inf | ||
| sky | -NaN | -Inf | -Inf |
| S/N | 28.6 | 43.6 | 53.3 |
| S/N(c) | 29.8 | 67.5 | 52.0 |
| SN(E/C) |


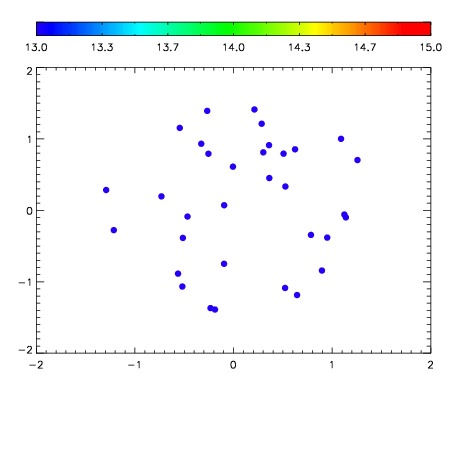

| Frame | Nreads | Zeropoints | Mag plots | Spatial mag deviation | Spatial sky 16325A emission deviations (filled: sky, open: star) | Spatial sky continuum emission | Spatial sky telluric CO2 absorption deviations (filled: H < 10) | |||||||||||||||||||||||
| 0 | 0 |
|
|
|
|
|
|
| IPAIR | NAME | SHIFT | NEWSHIFT | S/N | NAME | SHIFT | NEWSHIFT | S/N |
| 0 | 14950074 | 0.501630 | 0.00000 | 18.9534 | 14950075 | 0.00126623 | 0.500364 | 18.7705 |
| 1 | 14950069 | 0.498582 | 0.00304800 | 19.1136 | 14950071 | 0.000170294 | 0.501460 | 19.0703 |
| 2 | 14950070 | 0.499342 | 0.00228801 | 19.1047 | 14950068 | 0.00000 | 0.501630 | 18.8708 |
| 3 | 14950073 | 0.501443 | 0.000186980 | 18.5469 | 14950072 | 0.00264419 | 0.498986 | 16.8497 |