| Red | Green | Blue | |
| z | 17.64 | ||
| znorm | Inf | ||
| sky | -NaN | -NaN | -Inf |
| S/N | 32.1 | 47.4 | 59.2 |
| S/N(c) | 34.5 | 77.6 | 44.2 |
| SN(E/C) |
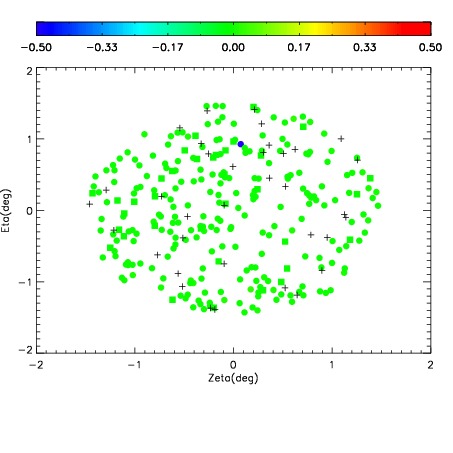
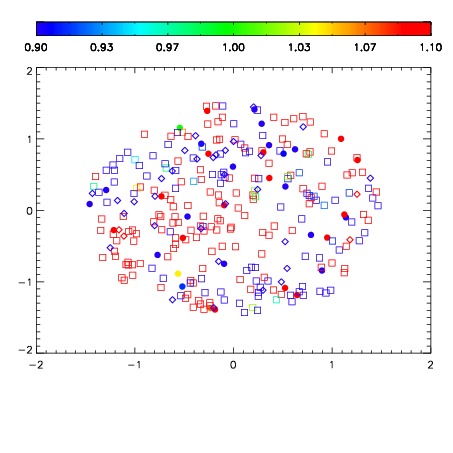
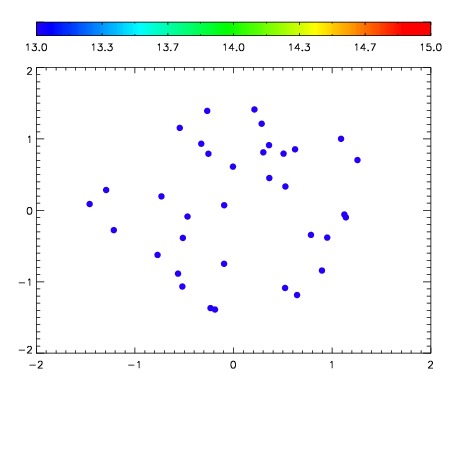

| Frame | Nreads | Zeropoints | Mag plots | Spatial mag deviation | Spatial sky 16325A emission deviations (filled: sky, open: star) | Spatial sky continuum emission | Spatial sky telluric CO2 absorption deviations (filled: H < 10) | |||||||||||||||||||||||
| 0 | 0 |
|
|
|
|
|
|
| IPAIR | NAME | SHIFT | NEWSHIFT | S/N | NAME | SHIFT | NEWSHIFT | S/N |
| 0 | 14990050 | 0.499747 | 0.00000 | 18.8468 | 14990041 | 0.00000 | 0.499747 | 18.9037 |
| 1 | 14990047 | 0.495881 | 0.00386602 | 18.8383 | 14990048 | 0.000689660 | 0.499057 | 18.8543 |
| 2 | 14990042 | 0.497143 | 0.00260401 | 18.8353 | 14990049 | 0.000664304 | 0.499083 | 18.8477 |
| 3 | 14990046 | 0.495423 | 0.00432402 | 18.8250 | 14990045 | -0.00157286 | 0.501320 | 18.7981 |
| 4 | 14990043 | 0.497102 | 0.00264502 | 18.8052 | 14990044 | -0.000790464 | 0.500537 | 18.7668 |