| Red | Green | Blue | |
| z | 17.64 | ||
| znorm | Inf | ||
| sky | -Inf | -NaN | -Inf |
| S/N | 33.9 | 50.6 | 60.4 |
| S/N(c) | 36.3 | 80.6 | 46.0 |
| SN(E/C) |


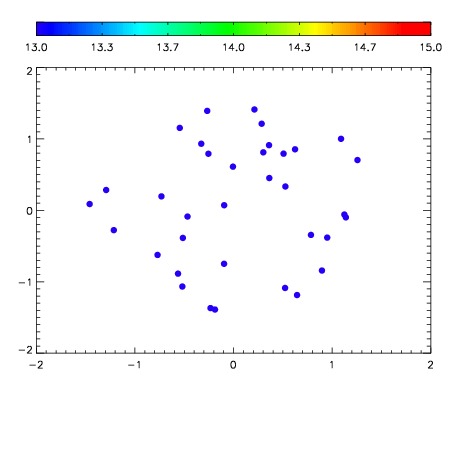

| Frame | Nreads | Zeropoints | Mag plots | Spatial mag deviation | Spatial sky 16325A emission deviations (filled: sky, open: star) | Spatial sky continuum emission | Spatial sky telluric CO2 absorption deviations (filled: H < 10) | |||||||||||||||||||||||
| 0 | 0 |
|
|
|
|
|
|
| IPAIR | NAME | SHIFT | NEWSHIFT | S/N | NAME | SHIFT | NEWSHIFT | S/N |
| 0 | 15010034 | 0.00893748 | 0.00000 | 19.1347 | 15010037 | -0.492828 | 0.501765 | 19.1638 |
| 1 | 15010038 | 0.00784597 | 0.00109151 | 19.1347 | 15010033 | -0.491779 | 0.500717 | 19.1486 |
| 2 | 15010035 | 0.00846202 | 0.000475460 | 19.1324 | 15010032 | -0.492384 | 0.501321 | 19.1083 |
| 3 | 15010031 | 0.00000 | 0.00893748 | 19.1131 | 15010036 | -0.492877 | 0.501814 | 19.0938 |