| Red | Green | Blue | |
| z | 17.64 | ||
| znorm | Inf | ||
| sky | -NaN | -Inf | -Inf |
| S/N | 28.9 | 45.9 | 52.9 |
| S/N(c) | 32.0 | 71.5 | 40.8 |
| SN(E/C) |


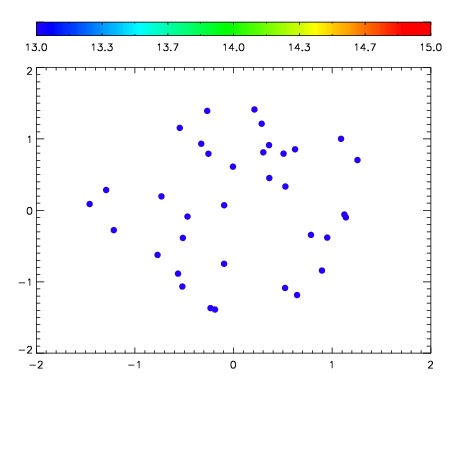

| Frame | Nreads | Zeropoints | Mag plots | Spatial mag deviation | Spatial sky 16325A emission deviations (filled: sky, open: star) | Spatial sky continuum emission | Spatial sky telluric CO2 absorption deviations (filled: H < 10) | |||||||||||||||||||||||
| 0 | 0 |
|
|
|
|
|
|
| IPAIR | NAME | SHIFT | NEWSHIFT | S/N | NAME | SHIFT | NEWSHIFT | S/N |
| 0 | 15020039 | 0.507603 | 0.00000 | 18.9197 | 15020037 | 0.00514983 | 0.502453 | 18.9068 |
| 1 | 15020038 | 0.506966 | 0.000636995 | 18.9147 | 15020033 | 0.00000 | 0.507603 | 18.9060 |
| 2 | 15020035 | 0.501250 | 0.00635296 | 18.8651 | 15020036 | 0.00499193 | 0.502611 | 18.9051 |
| 3 | 15020034 | 0.501586 | 0.00601697 | 18.8015 | 15020040 | 0.00279656 | 0.504806 | 18.8421 |