| Red | Green | Blue | |
| z | 17.60 | ||
| znorm | Inf | ||
| sky | -Inf | -Inf | -Inf |
| S/N | 7.2 | 13.5 | 15.2 |
| S/N(c) | 2.5 | 24.8 | 18.6 |
| SN(E/C) |
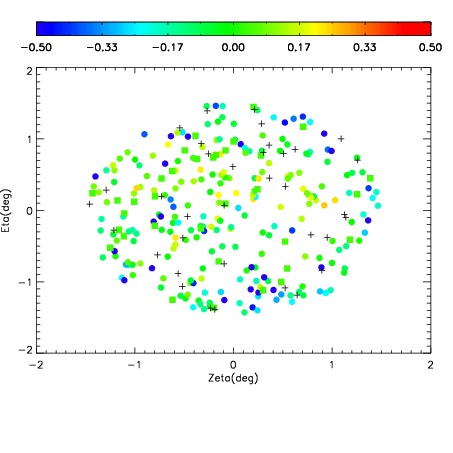
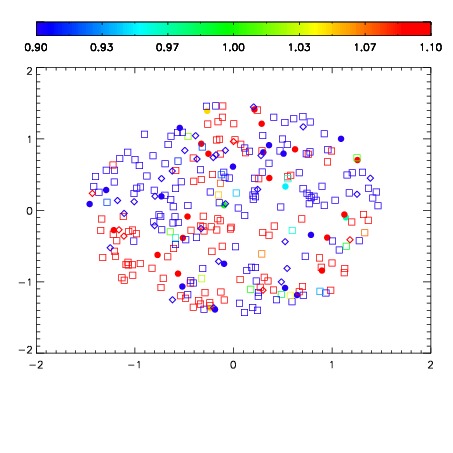
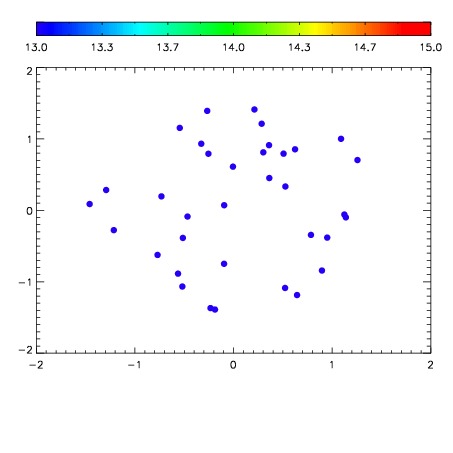

| Frame | Nreads | Zeropoints | Mag plots | Spatial mag deviation | Spatial sky 16325A emission deviations (filled: sky, open: star) | Spatial sky continuum emission | Spatial sky telluric CO2 absorption deviations (filled: H < 10) | |||||||||||||||||||||||
| 0 | 0 |
|
|
|
|
|
|
| IPAIR | NAME | SHIFT | NEWSHIFT | S/N | NAME | SHIFT | NEWSHIFT | S/N |
| 0 | 15500013 | 0.498073 | 0.00000 | 16.0850 | 15500011 | 0.00000 | 0.498073 | 17.1344 |
| 1 | 15500012 | 0.496933 | 0.00114000 | 17.8912 | 15500014 | 0.000507607 | 0.497565 | 17.4659 |