| Red | Green | Blue | |
| z | 17.65 | ||
| znorm | Inf | ||
| sky | -Inf | -Inf | -Inf |
| S/N | 22.7 | 36.1 | 43.0 |
| S/N(c) | 34.4 | 13.7 | 37.5 |
| SN(E/C) |
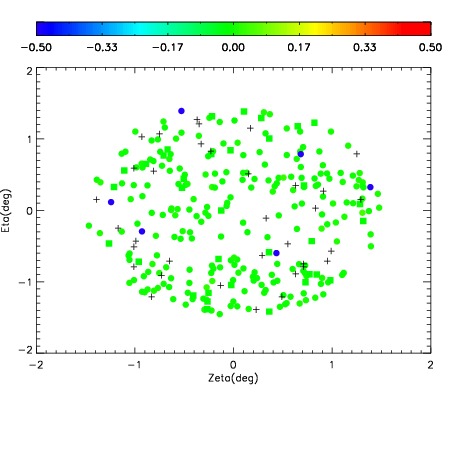
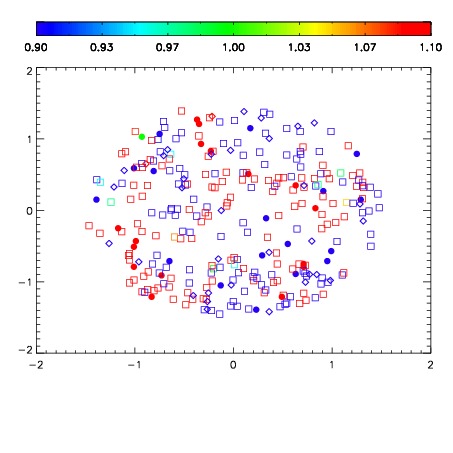


| Frame | Nreads | Zeropoints | Mag plots | Spatial mag deviation | Spatial sky 16325A emission deviations (filled: sky, open: star) | Spatial sky continuum emission | Spatial sky telluric CO2 absorption deviations (filled: H < 10) | |||||||||||||||||||||||
| 0 | 0 |
|
|
|
|
|
|
| IPAIR | NAME | SHIFT | NEWSHIFT | S/N | NAME | SHIFT | NEWSHIFT | S/N |
| 0 | 14960087 | 0.504256 | 0.00000 | 18.6772 | 14960084 | 0.00175763 | 0.502498 | 18.7213 |
| 1 | 14960086 | 0.503789 | 0.000467002 | 18.6367 | 14960085 | 0.00190468 | 0.502351 | 18.6654 |
| 2 | 14960083 | 0.502776 | 0.00147998 | 18.5611 | 14960088 | 0.00244353 | 0.501812 | 18.6430 |
| 3 | 14960082 | 0.502047 | 0.00220901 | 18.4694 | 14960081 | 0.00000 | 0.504256 | 18.5514 |