| Red | Green | Blue | |
| z | 17.64 | ||
| znorm | Inf | ||
| sky | -Inf | -Inf | -NaN |
| S/N | 24.5 | 38.4 | 43.0 |
| S/N(c) | 34.9 | 61.7 | 74.7 |
| SN(E/C) |
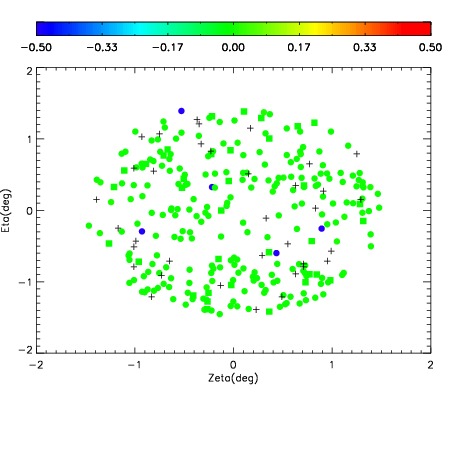
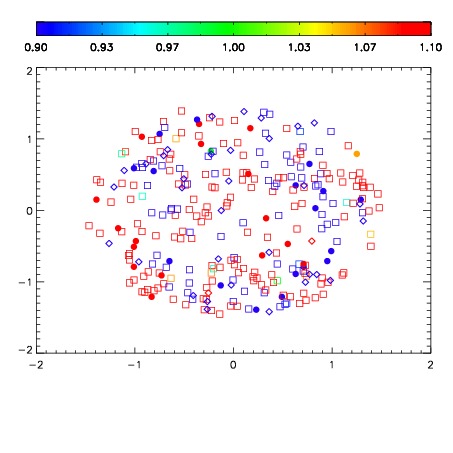
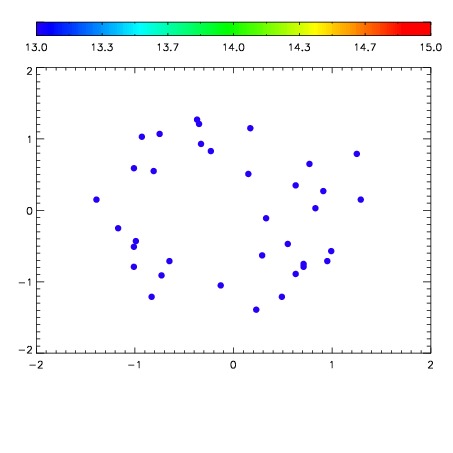

| Frame | Nreads | Zeropoints | Mag plots | Spatial mag deviation | Spatial sky 16325A emission deviations (filled: sky, open: star) | Spatial sky continuum emission | Spatial sky telluric CO2 absorption deviations (filled: H < 10) | |||||||||||||||||||||||
| 0 | 0 |
|
|
|
|
|
|
| IPAIR | NAME | SHIFT | NEWSHIFT | S/N | NAME | SHIFT | NEWSHIFT | S/N |
| 0 | 15570054 | 0.492209 | 0.00000 | 18.9286 | 15570051 | 0.00114682 | 0.491062 | 17.6890 |
| 1 | 15570053 | 0.490536 | 0.00167298 | 19.0166 | 15570055 | 0.000315071 | 0.491894 | 18.9852 |
| 2 | 15570049 | 0.491163 | 0.00104600 | 18.9558 | 15570048 | 0.00000 | 0.492209 | 18.8894 |
| 3 | 15570050 | 0.492109 | 9.99868e-05 | 18.7041 | 15570052 | 0.000778994 | 0.491430 | 17.6080 |