| Red | Green | Blue | |
| z | 17.63 | ||
| znorm | Inf | ||
| sky | -Inf | -Inf | -NaN |
| S/N | 28.9 | 46.2 | 52.2 |
| S/N(c) | 12.9 | 59.0 | 59.6 |
| SN(E/C) |
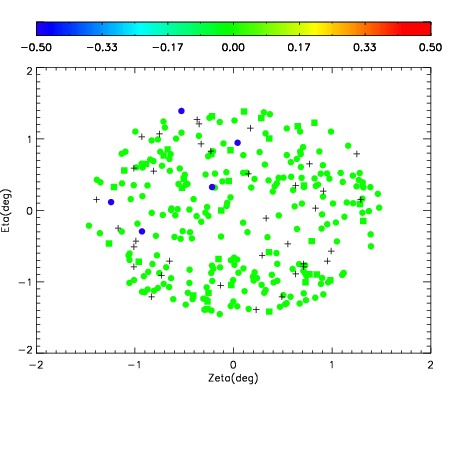
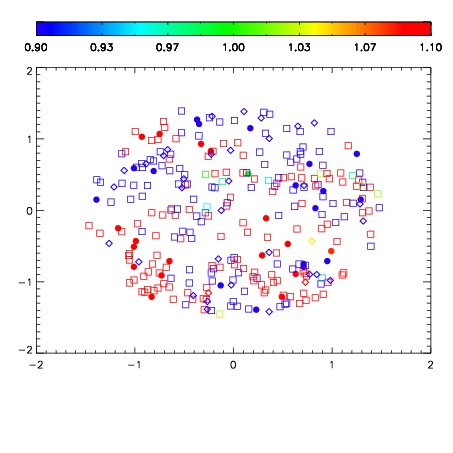
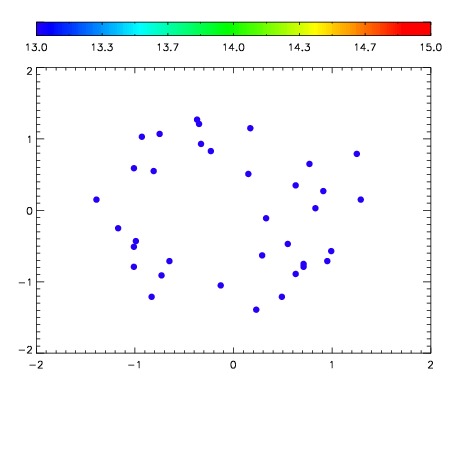

| Frame | Nreads | Zeropoints | Mag plots | Spatial mag deviation | Spatial sky 16325A emission deviations (filled: sky, open: star) | Spatial sky continuum emission | Spatial sky telluric CO2 absorption deviations (filled: H < 10) | |||||||||||||||||||||||
| 0 | 0 |
|
|
|
|
|
|
| IPAIR | NAME | SHIFT | NEWSHIFT | S/N | NAME | SHIFT | NEWSHIFT | S/N |
| 0 | 16060017 | 0.488875 | 0.00000 | 18.7639 | 16060015 | 0.00199153 | 0.486883 | 18.8422 |
| 1 | 16060012 | 0.487777 | 0.00109801 | 18.9016 | 16060014 | 0.00197679 | 0.486898 | 18.8949 |
| 2 | 16060013 | 0.488107 | 0.000768006 | 18.8820 | 16060011 | 0.00000 | 0.488875 | 18.8784 |
| 3 | 16060016 | 0.488597 | 0.000277996 | 18.8165 | 16060018 | 0.00280915 | 0.486066 | 18.8682 |