| Red | Green | Blue | |
| z | 17.63 | ||
| znorm | Inf | ||
| sky | -Inf | -Inf | -Inf |
| S/N | 31.5 | 49.4 | 56.8 |
| S/N(c) | 46.0 | 17.8 | 48.3 |
| SN(E/C) |
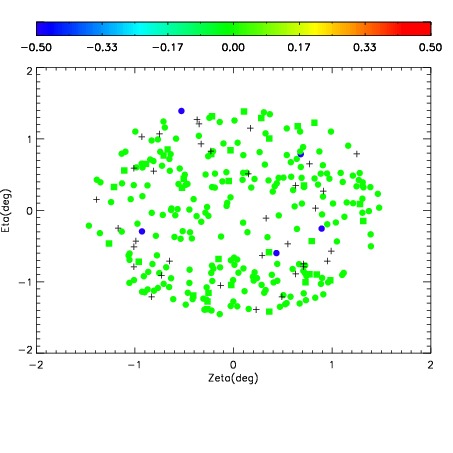
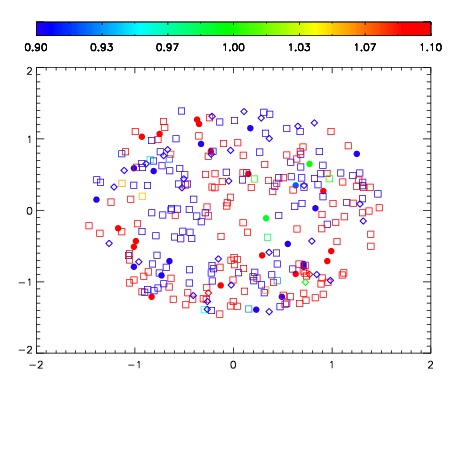
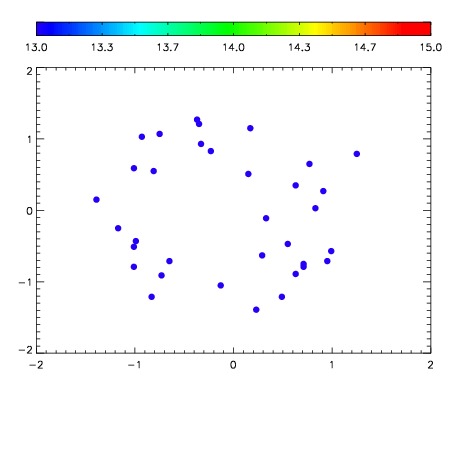

| Frame | Nreads | Zeropoints | Mag plots | Spatial mag deviation | Spatial sky 16325A emission deviations (filled: sky, open: star) | Spatial sky continuum emission | Spatial sky telluric CO2 absorption deviations (filled: H < 10) | |||||||||||||||||||||||
| 0 | 0 |
|
|
|
|
|
|
| IPAIR | NAME | SHIFT | NEWSHIFT | S/N | NAME | SHIFT | NEWSHIFT | S/N |
| 0 | 16090018 | 0.495697 | 0.00000 | 19.0008 | 16090015 | 0.000267505 | 0.495429 | 18.9323 |
| 1 | 16090017 | 0.494602 | 0.00109500 | 19.0038 | 16090019 | 0.00407714 | 0.491620 | 19.0092 |
| 2 | 16090014 | 0.491914 | 0.00378299 | 18.9338 | 16090016 | 0.00166314 | 0.494034 | 18.9201 |
| 3 | 16090013 | 0.492245 | 0.00345200 | 18.9295 | 16090012 | 0.00000 | 0.495697 | 18.8995 |