| Red | Green | Blue | |
| z | 17.64 | ||
| znorm | Inf | ||
| sky | -Inf | -Inf | -NaN |
| S/N | 32.0 | 48.3 | 58.4 |
| S/N(c) | 37.2 | 34.3 | 72.0 |
| SN(E/C) |
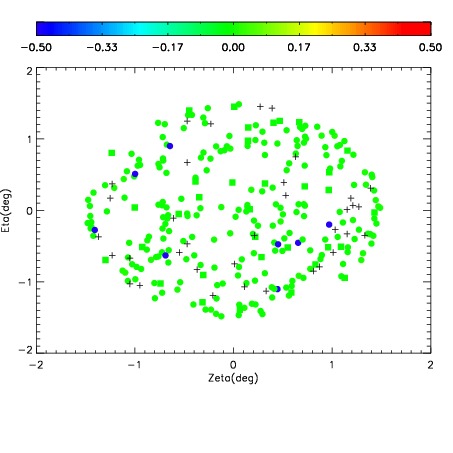
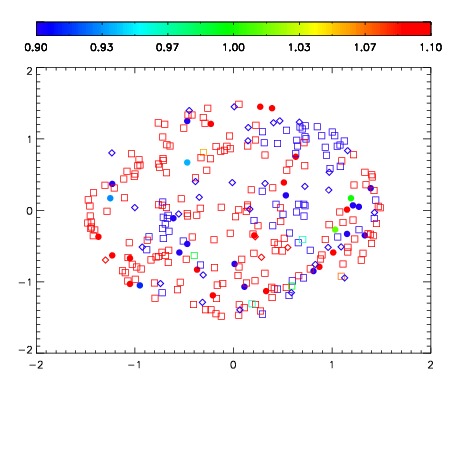
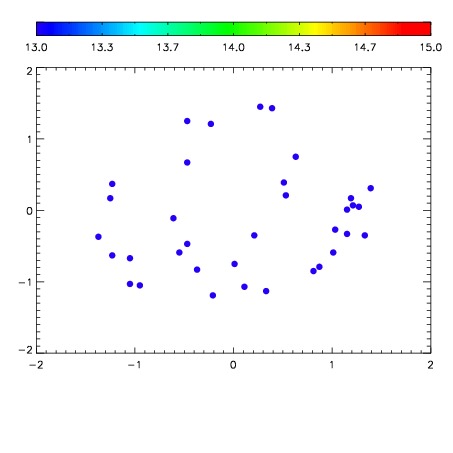

| Frame | Nreads | Zeropoints | Mag plots | Spatial mag deviation | Spatial sky 16325A emission deviations (filled: sky, open: star) | Spatial sky continuum emission | Spatial sky telluric CO2 absorption deviations (filled: H < 10) | |||||||||||||||||||||||
| 0 | 0 |
|
|
|
|
|
|
| IPAIR | NAME | SHIFT | NEWSHIFT | S/N | NAME | SHIFT | NEWSHIFT | S/N |
| 0 | 15310054 | 0.497498 | 0.00000 | 18.8653 | 15310052 | 0.000805221 | 0.496693 | 18.8753 |
| 1 | 15310049 | 0.495740 | 0.00175801 | 19.0485 | 15310048 | 0.00000 | 0.497498 | 19.0005 |
| 2 | 15310050 | 0.495732 | 0.00176600 | 18.9977 | 15310051 | 0.000791549 | 0.496706 | 18.9955 |
| 3 | 15310053 | 0.496822 | 0.000676006 | 18.8755 | 15310055 | 0.00211783 | 0.495380 | 18.8975 |