| Red | Green | Blue | |
| z | 17.64 | ||
| znorm | Inf | ||
| sky | -Inf | -Inf | -Inf |
| S/N | 29.4 | 44.0 | 53.4 |
| S/N(c) | 35.7 | 72.3 | 23.1 |
| SN(E/C) |
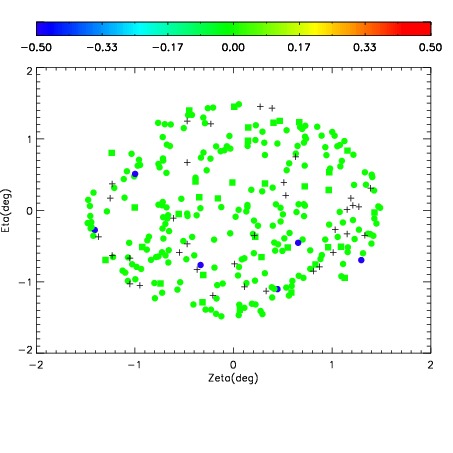
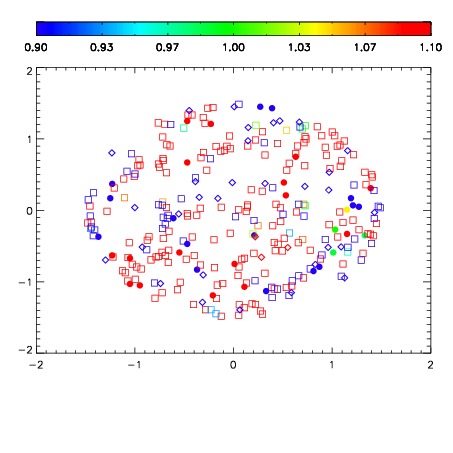
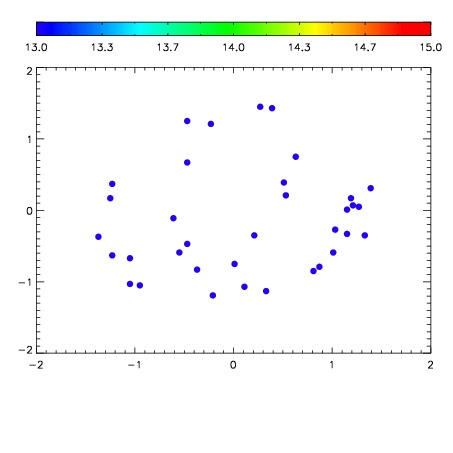

| Frame | Nreads | Zeropoints | Mag plots | Spatial mag deviation | Spatial sky 16325A emission deviations (filled: sky, open: star) | Spatial sky continuum emission | Spatial sky telluric CO2 absorption deviations (filled: H < 10) | |||||||||||||||||||||||
| 0 | 0 |
|
|
|
|
|
|
| IPAIR | NAME | SHIFT | NEWSHIFT | S/N | NAME | SHIFT | NEWSHIFT | S/N |
| 0 | 15520061 | 0.493757 | 0.00000 | 18.8642 | 15520062 | 0.00111873 | 0.492638 | 18.9161 |
| 1 | 15520064 | 0.492310 | 0.00144702 | 18.9840 | 15520066 | 0.000510408 | 0.493247 | 18.9708 |
| 2 | 15520065 | 0.493014 | 0.000743002 | 18.9687 | 15520063 | 0.000765139 | 0.492992 | 18.9677 |
| 3 | 15520060 | 0.493620 | 0.000137001 | 18.8337 | 15520059 | 0.00000 | 0.493757 | 18.7826 |