| Red | Green | Blue | |
| z | 17.64 | ||
| znorm | Inf | ||
| sky | -NaN | -Inf | -Inf |
| S/N | 9.0 | 14.7 | 17.7 |
| S/N(c) | 12.2 | 11.6 | 0.2 |
| SN(E/C) |
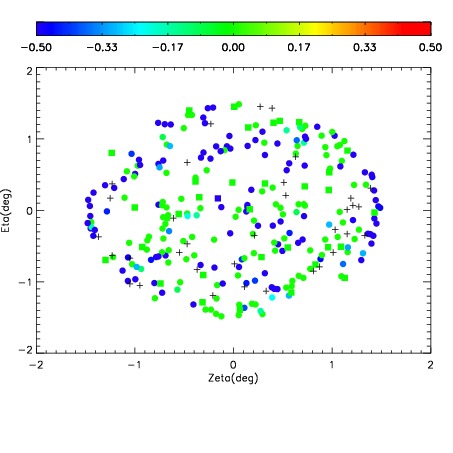
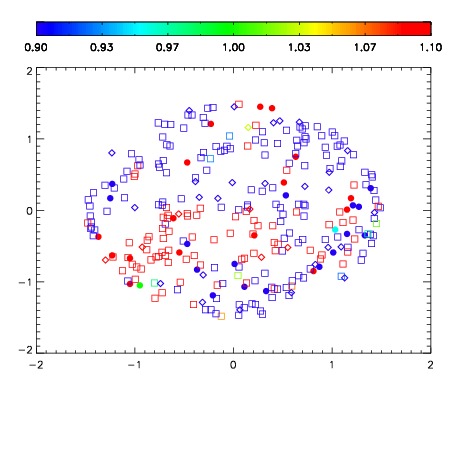
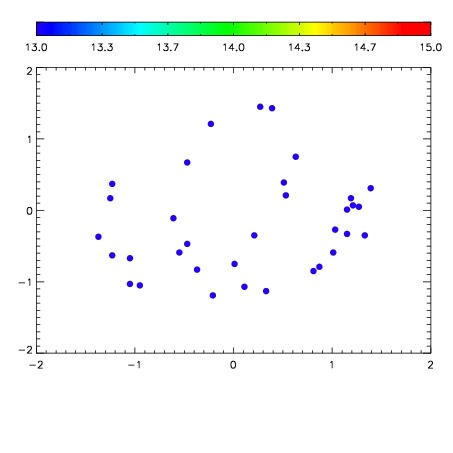

| Frame | Nreads | Zeropoints | Mag plots | Spatial mag deviation | Spatial sky 16325A emission deviations (filled: sky, open: star) | Spatial sky continuum emission | Spatial sky telluric CO2 absorption deviations (filled: H < 10) | |||||||||||||||||||||||
| 0 | 0 |
|
|
|
|
|
|
| IPAIR | NAME | SHIFT | NEWSHIFT | S/N | NAME | SHIFT | NEWSHIFT | S/N |
| 0 | 15580053 | 0.490619 | 0.00000 | 17.7090 | 15580051 | 0.00000 | 0.490619 | 17.9635 |
| 1 | 15580052 | 0.490612 | 7.00355e-06 | 17.6844 | 15580054 | 0.00112446 | 0.489495 | 17.3877 |