| Red | Green | Blue | |
| z | 17.64 | ||
| znorm | Inf | ||
| sky | -Inf | -Inf | -Inf |
| S/N | 25.6 | 38.7 | 46.4 |
| S/N(c) | 19.6 | 52.3 | 51.5 |
| SN(E/C) |
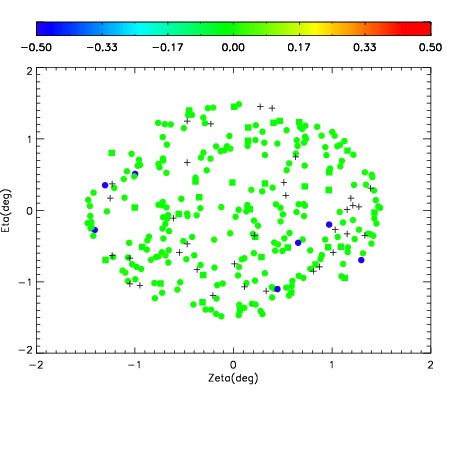
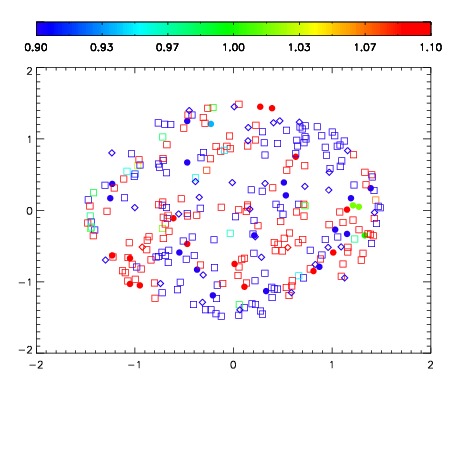
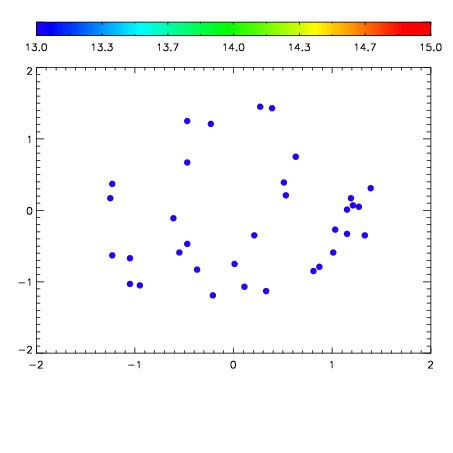

| Frame | Nreads | Zeropoints | Mag plots | Spatial mag deviation | Spatial sky 16325A emission deviations (filled: sky, open: star) | Spatial sky continuum emission | Spatial sky telluric CO2 absorption deviations (filled: H < 10) | |||||||||||||||||||||||
| 0 | 0 |
|
|
|
|
|
|
| IPAIR | NAME | SHIFT | NEWSHIFT | S/N | NAME | SHIFT | NEWSHIFT | S/N |
| 0 | 15750024 | 0.488272 | 0.00000 | 18.8318 | 15750025 | 0.00286527 | 0.485407 | 18.8734 |
| 1 | 15750023 | 0.488219 | 5.30183e-05 | 18.8169 | 15750022 | 0.00000 | 0.488272 | 18.8480 |
| 2 | 15750027 | 0.488112 | 0.000160009 | 18.7928 | 15750026 | 0.00175429 | 0.486518 | 18.8058 |