| Red | Green | Blue | |
| z | 17.65 | ||
| znorm | Inf | ||
| sky | -Inf | -Inf | -NaN |
| S/N | 33.1 | 52.4 | 58.5 |
| S/N(c) | 20.7 | 66.9 | 75.4 |
| SN(E/C) |
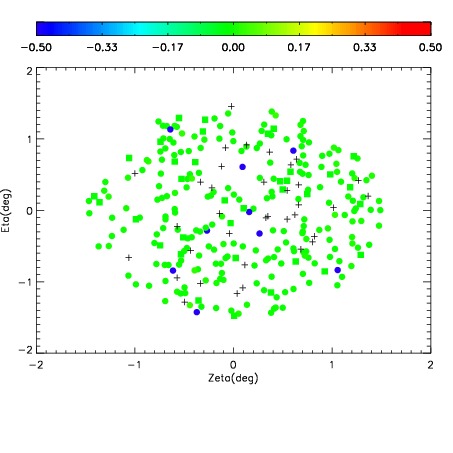
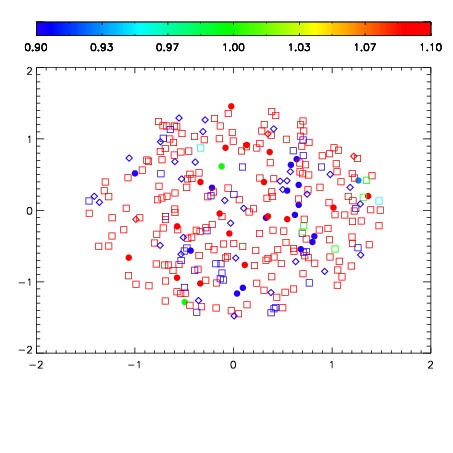


| Frame | Nreads | Zeropoints | Mag plots | Spatial mag deviation | Spatial sky 16325A emission deviations (filled: sky, open: star) | Spatial sky continuum emission | Spatial sky telluric CO2 absorption deviations (filled: H < 10) | |||||||||||||||||||||||
| 0 | 0 |
|
|
|
|
|
|
| IPAIR | NAME | SHIFT | NEWSHIFT | S/N | NAME | SHIFT | NEWSHIFT | S/N |
| 0 | 14970090 | 0.00219007 | 0.00000 | 19.0988 | 14970091 | -0.500078 | 0.502268 | 19.0619 |
| 1 | 14970089 | 0.00193608 | 0.000253990 | 19.0586 | 14970092 | -0.500312 | 0.502502 | 19.0475 |
| 2 | 14970093 | 0.00206465 | 0.000125420 | 19.0412 | 14970088 | -0.498902 | 0.501092 | 19.0275 |
| 3 | 14970086 | 0.00000 | 0.00219007 | 18.9366 | 14970087 | -0.499384 | 0.501574 | 18.9844 |