| Red | Green | Blue | |
| z | 17.64 | ||
| znorm | Inf | ||
| sky | -Inf | -Inf | -NaN |
| S/N | 31.0 | 48.5 | 56.8 |
| S/N(c) | 42.5 | 61.7 | 41.6 |
| SN(E/C) |
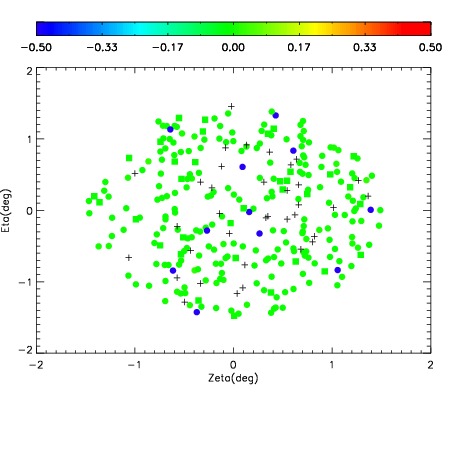

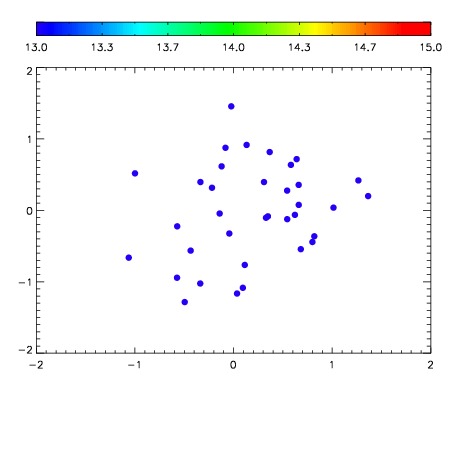

| Frame | Nreads | Zeropoints | Mag plots | Spatial mag deviation | Spatial sky 16325A emission deviations (filled: sky, open: star) | Spatial sky continuum emission | Spatial sky telluric CO2 absorption deviations (filled: H < 10) | |||||||||||||||||||||||
| 0 | 0 |
|
|
|
|
|
|
| IPAIR | NAME | SHIFT | NEWSHIFT | S/N | NAME | SHIFT | NEWSHIFT | S/N |
| 0 | 15000065 | 0.498997 | 0.00000 | 19.1269 | 15000066 | -0.000414370 | 0.499411 | 19.1519 |
| 1 | 15000064 | 0.498914 | 8.29995e-05 | 19.1250 | 15000059 | 0.00000 | 0.498997 | 19.0322 |
| 2 | 15000060 | 0.497025 | 0.00197199 | 19.0316 | 15000063 | 0.000204623 | 0.498792 | 19.0267 |
| 3 | 15000061 | 0.497207 | 0.00179002 | 18.8428 | 15000062 | -0.000531633 | 0.499529 | 19.0263 |