| Red | Green | Blue | |
| z | 17.64 | ||
| znorm | Inf | ||
| sky | -Inf | -Inf | -NaN |
| S/N | 32.5 | 51.9 | 57.7 |
| S/N(c) | 46.4 | 64.2 | 46.9 |
| SN(E/C) |
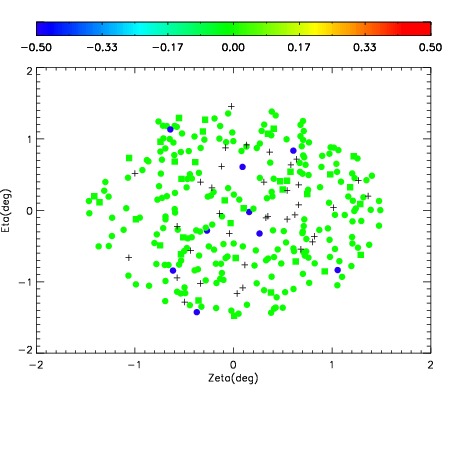
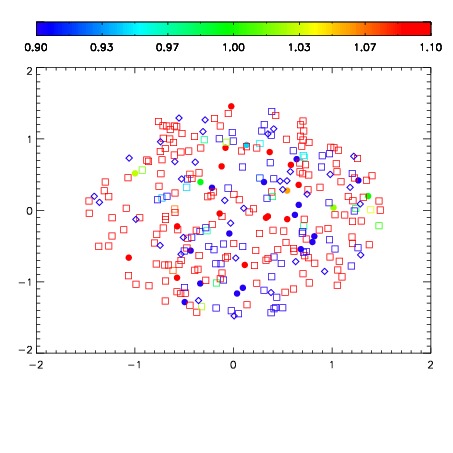
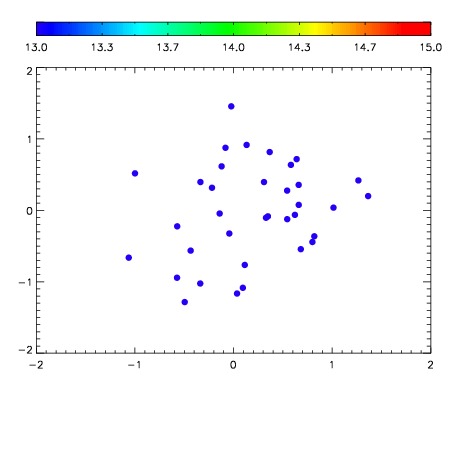

| Frame | Nreads | Zeropoints | Mag plots | Spatial mag deviation | Spatial sky 16325A emission deviations (filled: sky, open: star) | Spatial sky continuum emission | Spatial sky telluric CO2 absorption deviations (filled: H < 10) | |||||||||||||||||||||||
| 0 | 0 |
|
|
|
|
|
|
| IPAIR | NAME | SHIFT | NEWSHIFT | S/N | NAME | SHIFT | NEWSHIFT | S/N |
| 0 | 15520050 | 0.492786 | 0.00000 | 18.9435 | 15520052 | -0.000941939 | 0.493728 | 18.9540 |
| 1 | 15520054 | 0.490856 | 0.00193000 | 18.9376 | 15520055 | -0.000751583 | 0.493538 | 18.9446 |
| 2 | 15520049 | 0.492015 | 0.000770986 | 18.9263 | 15520051 | -0.000522629 | 0.493309 | 18.9424 |
| 3 | 15520053 | 0.490932 | 0.00185400 | 18.9083 | 15520048 | 0.00000 | 0.492786 | 18.9007 |