| Red | Green | Blue | |
| z | 17.65 | ||
| znorm | Inf | ||
| sky | -Inf | -Inf | -NaN |
| S/N | 16.4 | 26.7 | 29.9 |
| S/N(c) | 9.5 | 33.0 | 35.9 |
| SN(E/C) |
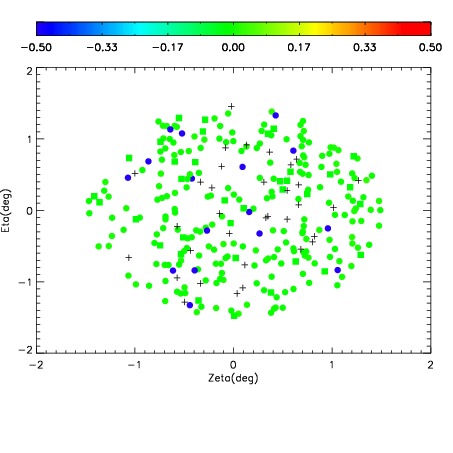
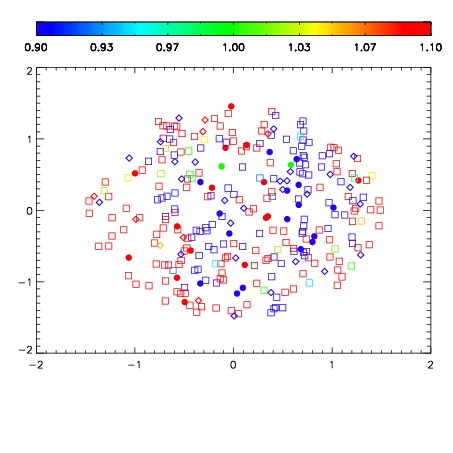


| Frame | Nreads | Zeropoints | Mag plots | Spatial mag deviation | Spatial sky 16325A emission deviations (filled: sky, open: star) | Spatial sky continuum emission | Spatial sky telluric CO2 absorption deviations (filled: H < 10) | |||||||||||||||||||||||
| 0 | 0 |
|
|
|
|
|
|
| IPAIR | NAME | SHIFT | NEWSHIFT | S/N | NAME | SHIFT | NEWSHIFT | S/N |
| 0 | 15560025 | 0.491308 | 0.00000 | 16.6284 | 15560028 | 0.00199318 | 0.489315 | 16.2066 |
| 1 | 15560030 | 0.488187 | 0.00312102 | 18.7133 | 15560031 | -0.000229899 | 0.491538 | 18.9146 |
| 2 | 15560026 | 0.490594 | 0.000714004 | 17.4561 | 15560024 | 0.00000 | 0.491308 | 18.3845 |
| 3 | 15560029 | 0.489031 | 0.00227702 | 16.7955 | 15560027 | 0.00257484 | 0.488733 | 16.5056 |