| Red | Green | Blue | |
| z | 17.64 | ||
| znorm | Inf | ||
| sky | -NaN | -Inf | -NaN |
| S/N | 30.1 | 48.8 | 54.5 |
| S/N(c) | 36.1 | 53.2 | 0.4 |
| SN(E/C) |
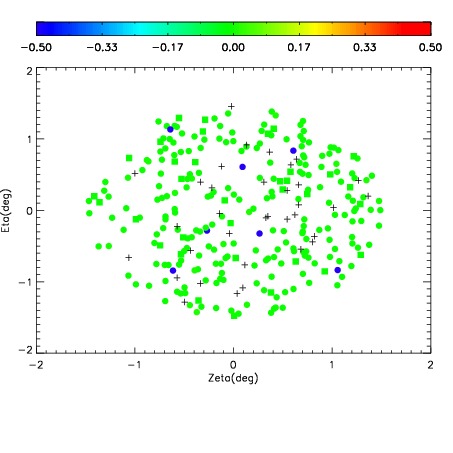
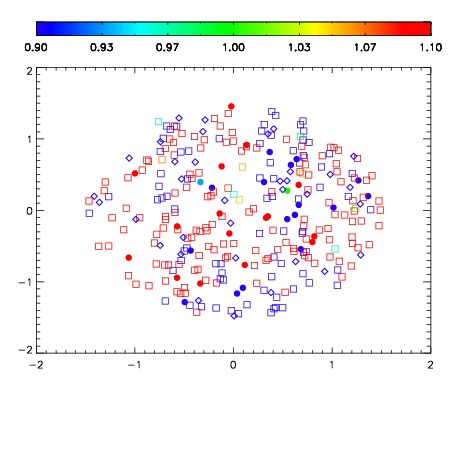
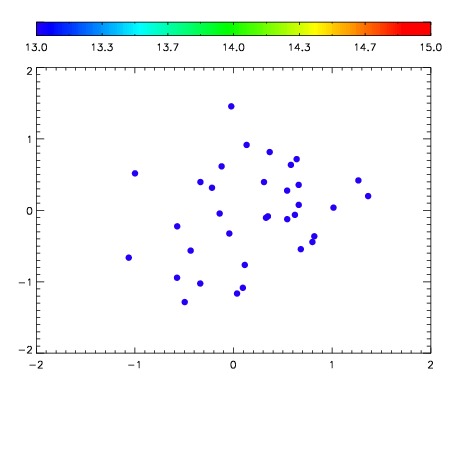

| Frame | Nreads | Zeropoints | Mag plots | Spatial mag deviation | Spatial sky 16325A emission deviations (filled: sky, open: star) | Spatial sky continuum emission | Spatial sky telluric CO2 absorption deviations (filled: H < 10) | |||||||||||||||||||||||
| 0 | 0 |
|
|
|
|
|
|
| IPAIR | NAME | SHIFT | NEWSHIFT | S/N | NAME | SHIFT | NEWSHIFT | S/N |
| 0 | 15590050 | 0.00177656 | 0.00000 | 18.8406 | 15590052 | -0.487044 | 0.488821 | 18.7953 |
| 1 | 15590051 | 0.00174061 | 3.59500e-05 | 18.8429 | 15590053 | -0.487142 | 0.488919 | 18.8279 |
| 2 | 15590047 | 0.00000 | 0.00177656 | 18.8074 | 15590049 | -0.488453 | 0.490230 | 18.7610 |
| 3 | 15590054 | 0.00160447 | 0.000172090 | 18.7584 | 15590048 | -0.488144 | 0.489921 | 18.6997 |