| Red | Green | Blue | |
| z | 17.64 | ||
| znorm | Inf | ||
| sky | -Inf | -Inf | -Inf |
| S/N | 27.0 | 44.3 | 50.0 |
| S/N(c) | 36.5 | 52.3 | 34.7 |
| SN(E/C) |
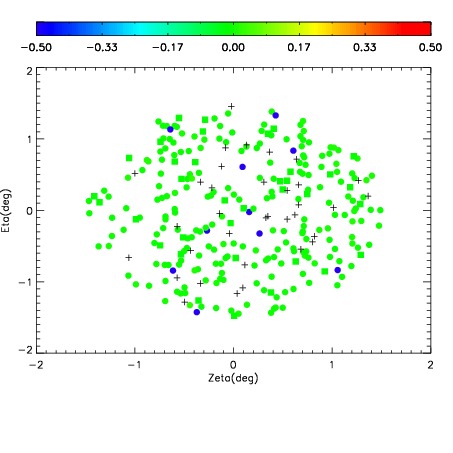
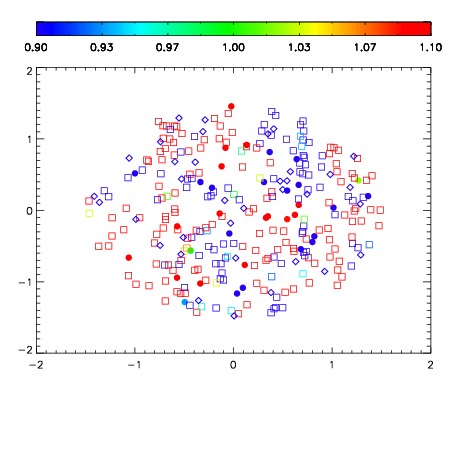


| Frame | Nreads | Zeropoints | Mag plots | Spatial mag deviation | Spatial sky 16325A emission deviations (filled: sky, open: star) | Spatial sky continuum emission | Spatial sky telluric CO2 absorption deviations (filled: H < 10) | |||||||||||||||||||||||
| 0 | 0 |
|
|
|
|
|
|
| IPAIR | NAME | SHIFT | NEWSHIFT | S/N | NAME | SHIFT | NEWSHIFT | S/N |
| 0 | 15790042 | 0.484505 | 0.00000 | 18.7079 | 15790039 | 0.00123180 | 0.483273 | 18.7213 |
| 1 | 15790041 | 0.483300 | 0.00120500 | 18.7267 | 15790040 | 0.00144116 | 0.483064 | 18.7300 |
| 2 | 15790037 | 0.482947 | 0.00155801 | 18.5762 | 15790043 | 0.00143758 | 0.483067 | 18.7170 |
| 3 | 15790038 | 0.483205 | 0.00130001 | 18.5144 | 15790036 | 0.00000 | 0.484505 | 18.5544 |