| Red | Green | Blue | |
| z | 17.64 | ||
| znorm | Inf | ||
| sky | -NaN | -Inf | -NaN |
| S/N | 30.2 | 48.5 | 55.7 |
| S/N(c) | 45.9 | 62.1 | 42.3 |
| SN(E/C) |

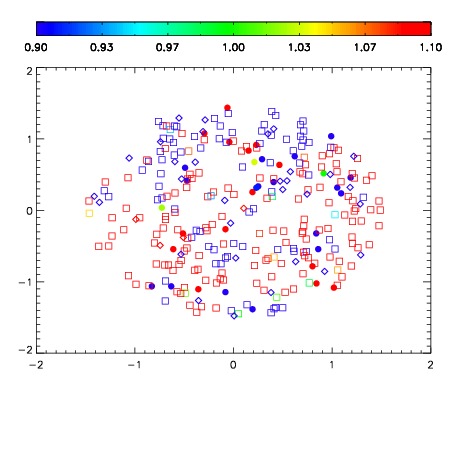


| Frame | Nreads | Zeropoints | Mag plots | Spatial mag deviation | Spatial sky 16325A emission deviations (filled: sky, open: star) | Spatial sky continuum emission | Spatial sky telluric CO2 absorption deviations (filled: H < 10) | |||||||||||||||||||||||
| 0 | 0 |
|
|
|
|
|
|
| IPAIR | NAME | SHIFT | NEWSHIFT | S/N | NAME | SHIFT | NEWSHIFT | S/N |
| 0 | 14980062 | 0.498982 | 0.00000 | 18.9575 | 14980063 | -0.00190204 | 0.500884 | 18.9567 |
| 1 | 14980065 | 0.497456 | 0.00152600 | 19.0039 | 14980067 | -0.00143472 | 0.500417 | 19.0238 |
| 2 | 14980066 | 0.498903 | 7.90060e-05 | 18.9880 | 14980064 | -0.00252522 | 0.501507 | 19.0003 |
| 3 | 14980061 | 0.498652 | 0.000330001 | 18.9394 | 14980060 | 0.00000 | 0.498982 | 18.9219 |