| Red | Green | Blue | |
| z | 17.64 | ||
| znorm | Inf | ||
| sky | -Inf | -Inf | -NaN |
| S/N | 30.5 | 50.1 | 56.7 |
| S/N(c) | 0.3 | 31.6 | 0.5 |
| SN(E/C) |
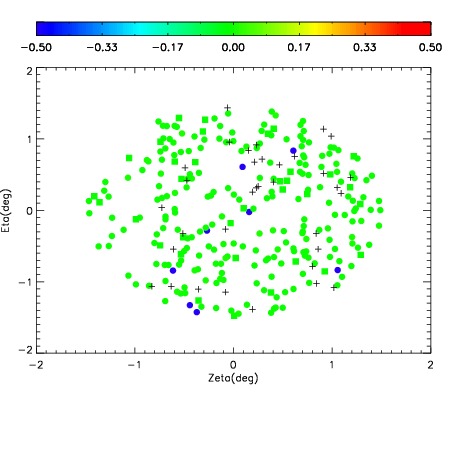


| Frame | Nreads | Zeropoints | Mag plots | Spatial mag deviation | Spatial sky 16325A emission deviations (filled: sky, open: star) | Spatial sky continuum emission | Spatial sky telluric CO2 absorption deviations (filled: H < 10) | |||||||||||||||||||||||
| 0 | 0 |
|
|
|
|
|
|
| IPAIR | NAME | SHIFT | NEWSHIFT | S/N | NAME | SHIFT | NEWSHIFT | S/N |
| 0 | 15020028 | 0.503087 | 0.00000 | 18.9165 | 15020026 | 0.00101652 | 0.502070 | 18.8271 |
| 1 | 15020024 | 0.501723 | 0.00136399 | 18.9675 | 15020029 | -0.00324235 | 0.506329 | 18.9509 |
| 2 | 15020027 | 0.502547 | 0.000539958 | 18.8807 | 15020025 | 0.000288248 | 0.502799 | 18.7993 |
| 3 | 15020023 | 0.501571 | 0.00151598 | 18.8796 | 15020022 | 0.00000 | 0.503087 | 18.7805 |