| Red | Green | Blue | |
| z | 17.64 | ||
| znorm | Inf | ||
| sky | -Inf | -Inf | -NaN |
| S/N | 35.1 | 55.4 | 62.6 |
| S/N(c) | 43.1 | 58.3 | 0.5 |
| SN(E/C) |
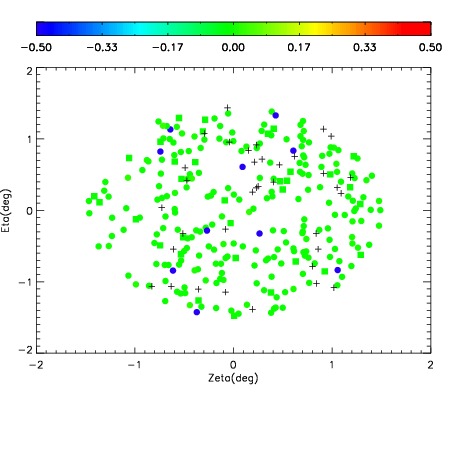
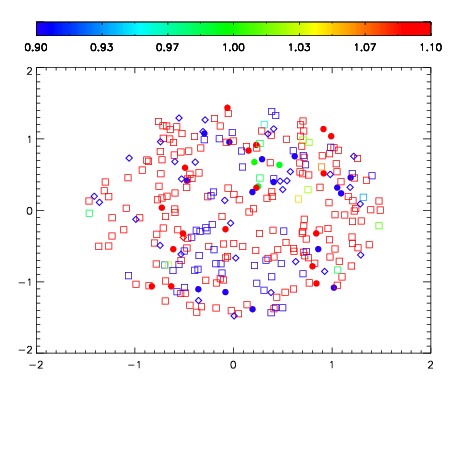
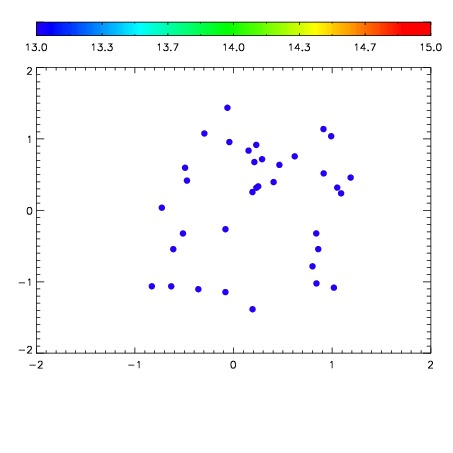

| Frame | Nreads | Zeropoints | Mag plots | Spatial mag deviation | Spatial sky 16325A emission deviations (filled: sky, open: star) | Spatial sky continuum emission | Spatial sky telluric CO2 absorption deviations (filled: H < 10) | |||||||||||||||||||||||
| 0 | 0 |
|
|
|
|
|
|
| IPAIR | NAME | SHIFT | NEWSHIFT | S/N | NAME | SHIFT | NEWSHIFT | S/N |
| 0 | 15600051 | 0.00246944 | 0.00000 | 19.1137 | 15600052 | -0.488008 | 0.490477 | 19.1142 |
| 1 | 15600050 | 0.00193228 | 0.000537160 | 19.1258 | 15600048 | -0.487967 | 0.490436 | 19.1353 |
| 2 | 15600047 | 0.00000 | 0.00246944 | 19.1192 | 15600049 | -0.487479 | 0.489948 | 19.1343 |
| 3 | 15600054 | 0.00224745 | 0.000221990 | 19.0139 | 15600053 | -0.488268 | 0.490737 | 19.1000 |