| Red | Green | Blue | |
| z | 17.64 | ||
| znorm | Inf | ||
| sky | -Inf | -NaN | -NaN |
| S/N | 33.2 | 52.9 | 58.9 |
| S/N(c) | 40.2 | 64.7 | 39.6 |
| SN(E/C) |
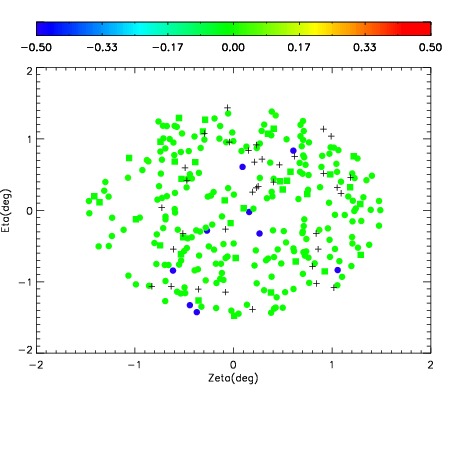
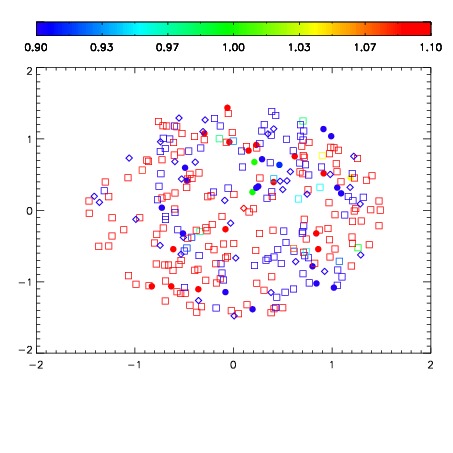
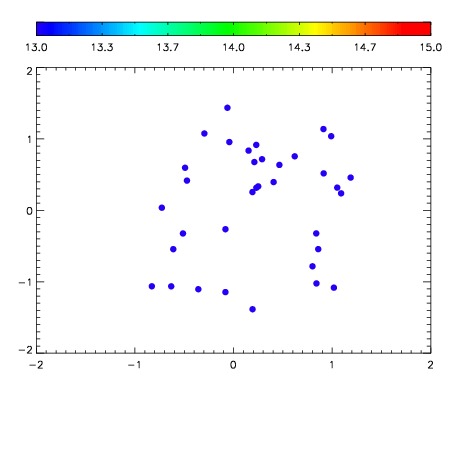

| Frame | Nreads | Zeropoints | Mag plots | Spatial mag deviation | Spatial sky 16325A emission deviations (filled: sky, open: star) | Spatial sky continuum emission | Spatial sky telluric CO2 absorption deviations (filled: H < 10) | |||||||||||||||||||||||
| 0 | 0 |
|
|
|
|
|
|
| IPAIR | NAME | SHIFT | NEWSHIFT | S/N | NAME | SHIFT | NEWSHIFT | S/N |
| 0 | 15800040 | 0.485030 | 0.00000 | 18.9831 | 15800034 | 0.00000 | 0.485030 | 19.0000 |
| 1 | 15800035 | 0.484458 | 0.000571996 | 19.0075 | 15800038 | 0.00120665 | 0.483823 | 19.0036 |
| 2 | 15800039 | 0.484253 | 0.000777006 | 18.9800 | 15800037 | 0.00132497 | 0.483705 | 18.9997 |
| 3 | 15800036 | 0.484901 | 0.000128984 | 18.9506 | 15800041 | 0.00151356 | 0.483516 | 18.9475 |