| Red | Green | Blue | |
| z | 17.63 | ||
| znorm | Inf | ||
| sky | -NaN | -NaN | -NaN |
| S/N | 25.5 | 41.4 | 45.9 |
| S/N(c) | 33.2 | 45.0 | 31.4 |
| SN(E/C) |
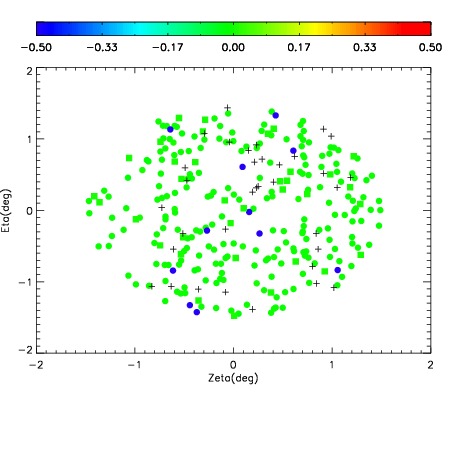
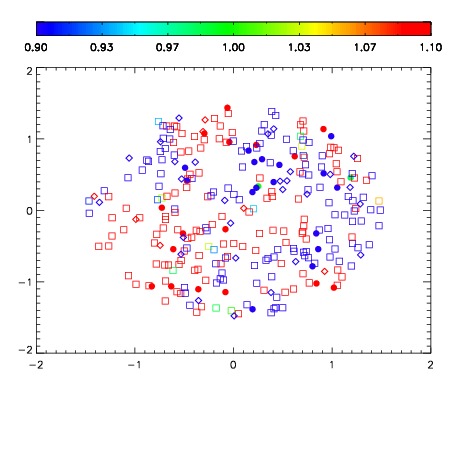
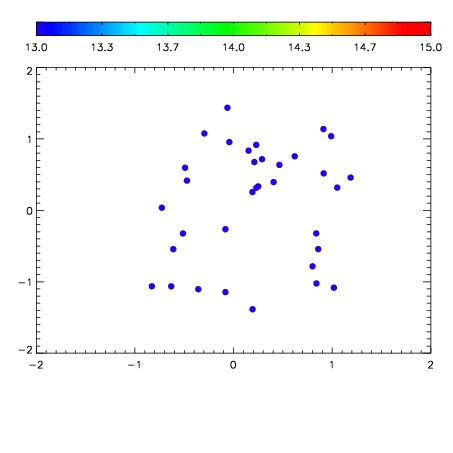

| Frame | Nreads | Zeropoints | Mag plots | Spatial mag deviation | Spatial sky 16325A emission deviations (filled: sky, open: star) | Spatial sky continuum emission | Spatial sky telluric CO2 absorption deviations (filled: H < 10) | |||||||||||||||||||||||
| 0 | 0 |
|
|
|
|
|
|
| IPAIR | NAME | SHIFT | NEWSHIFT | S/N | NAME | SHIFT | NEWSHIFT | S/N |
| 0 | 15860013 | 0.489725 | 0.00000 | 18.8045 | 15860014 | 0.00169132 | 0.488034 | 18.8647 |
| 1 | 15860012 | 0.488853 | 0.000871986 | 18.9095 | 15860011 | 0.00000 | 0.489725 | 18.9111 |
| 2 | 15860016 | 0.489664 | 6.10054e-05 | 18.4020 | 15860015 | 0.00266675 | 0.487058 | 18.7362 |