| Red | Green | Blue | |
| z | 17.65 | ||
| znorm | Inf | ||
| sky | -Inf | -Inf | -NaN |
| S/N | 12.6 | 23.0 | 25.2 |
| S/N(c) | 17.4 | 26.7 | 18.7 |
| SN(E/C) |
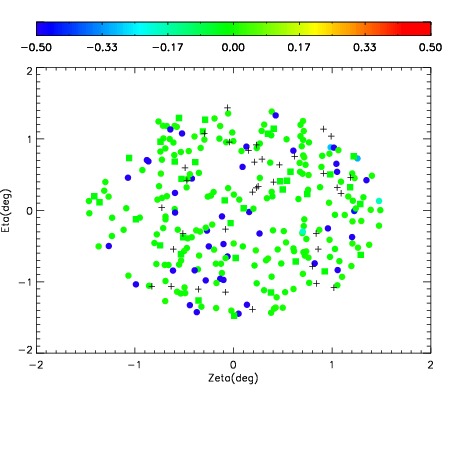
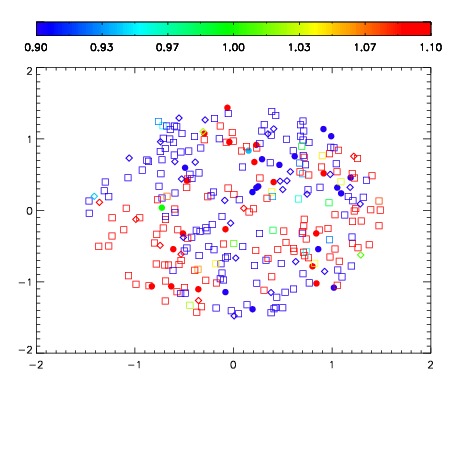


| Frame | Nreads | Zeropoints | Mag plots | Spatial mag deviation | Spatial sky 16325A emission deviations (filled: sky, open: star) | Spatial sky continuum emission | Spatial sky telluric CO2 absorption deviations (filled: H < 10) | |||||||||||||||||||||||
| 0 | 0 |
|
|
|
|
|
|
| IPAIR | NAME | SHIFT | NEWSHIFT | S/N | NAME | SHIFT | NEWSHIFT | S/N |
| 0 | 16050017 | 0.493770 | 0.00000 | 16.8253 | 16050018 | 0.00320651 | 0.490563 | 16.9646 |
| 1 | 16050016 | 0.492262 | 0.00150800 | 17.9792 | 16050015 | 0.00175656 | 0.492013 | 17.8717 |
| 2 | 16050012 | 0.492065 | 0.00170499 | 17.9565 | 16050011 | 0.00000 | 0.493770 | 17.5083 |
| 3 | 16050013 | 0.492099 | 0.00167102 | 16.7166 | 16050014 | 0.00147629 | 0.492294 | 16.8086 |