| Frame | Nreads | Zeropoints | Mag plots
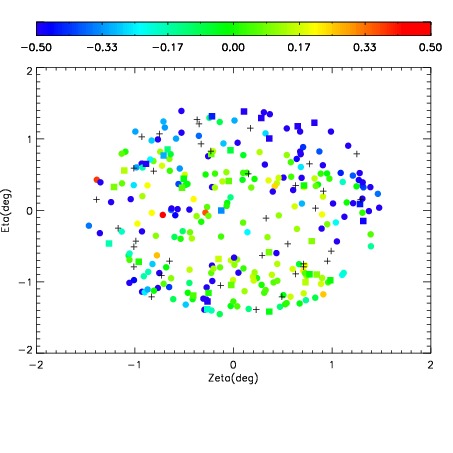
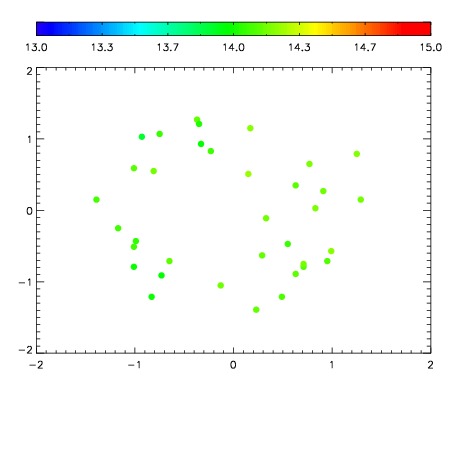
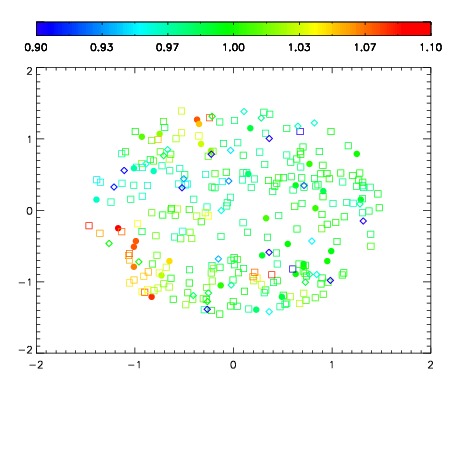
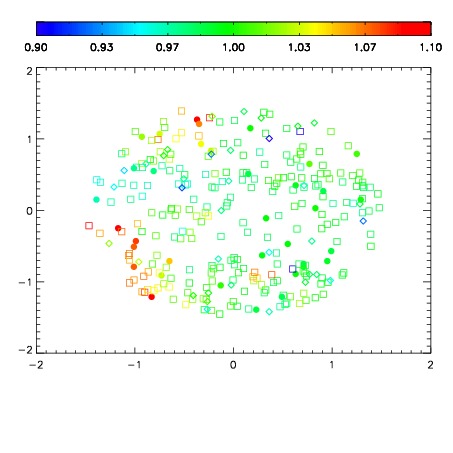
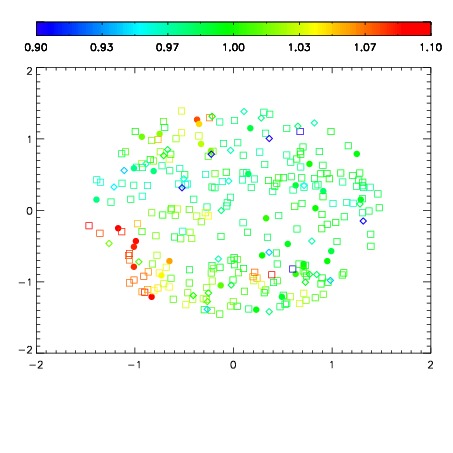
| Spatial mag deviation
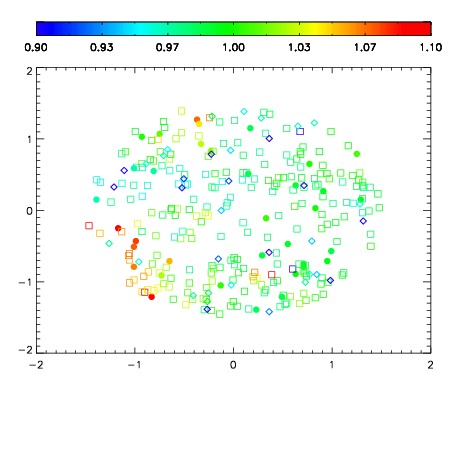
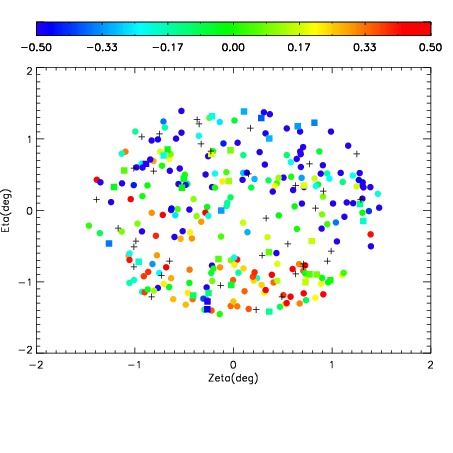
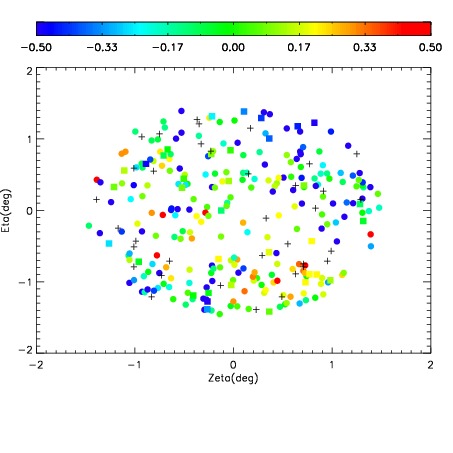
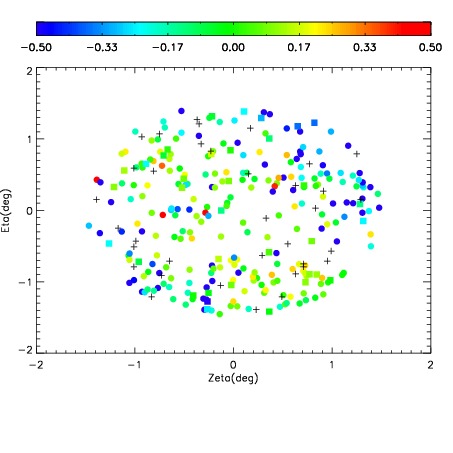
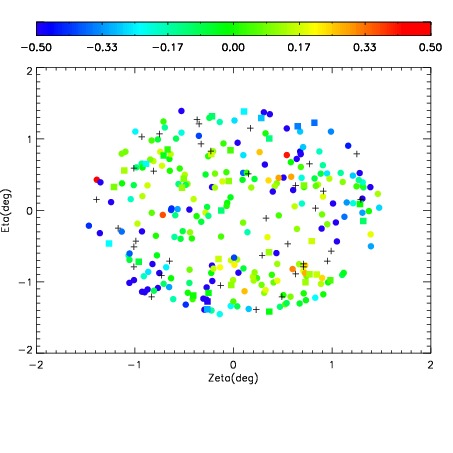
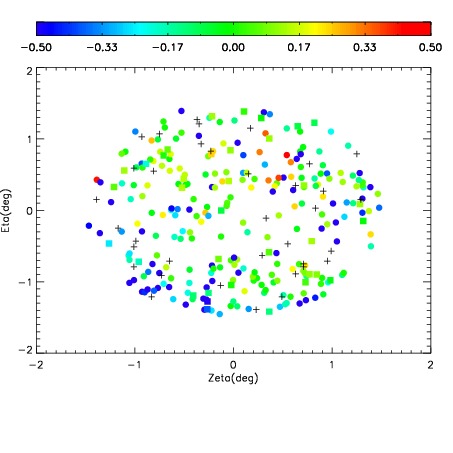
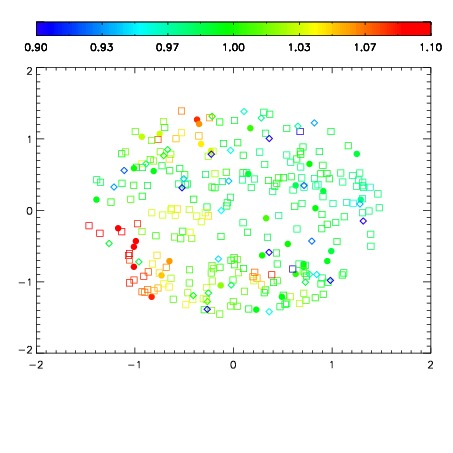
| Spatial sky 16325A emission deviations (filled: sky, open: star)
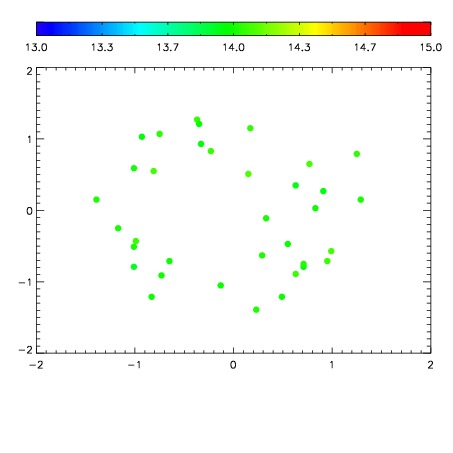
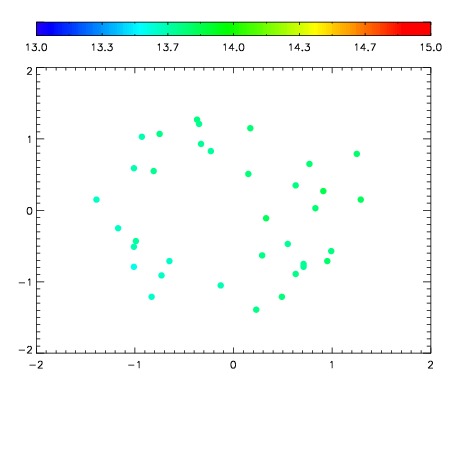
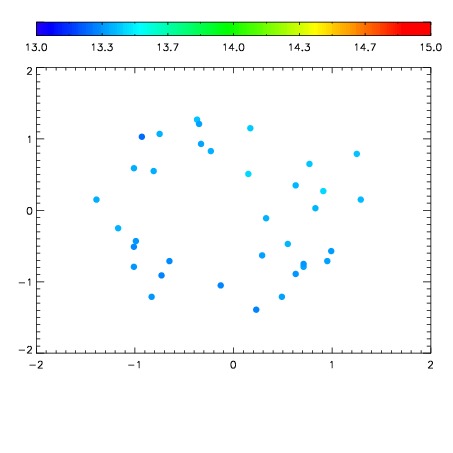
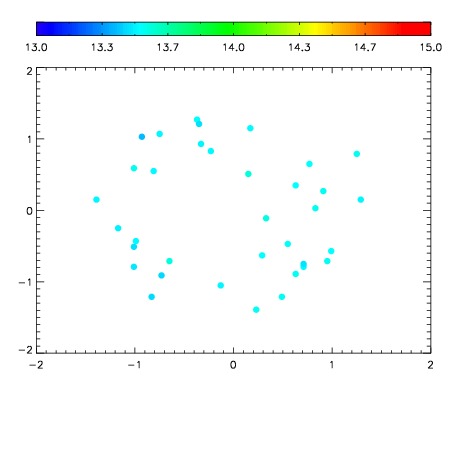
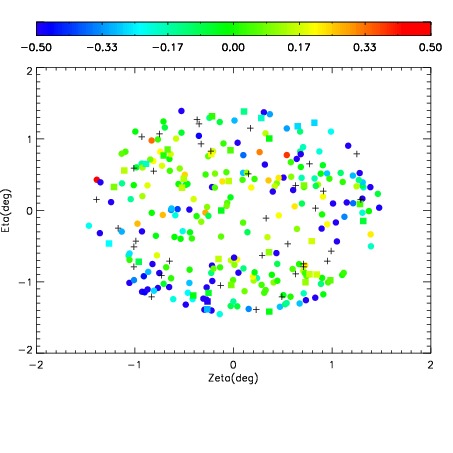
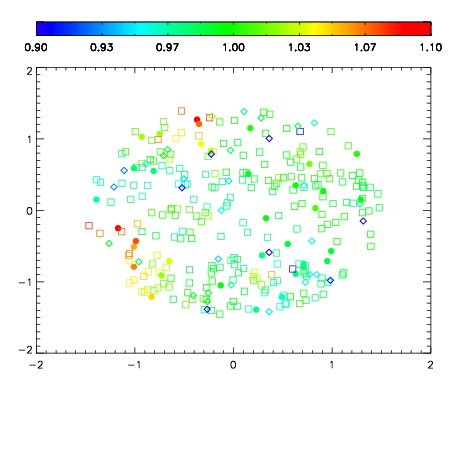
| Spatial sky continuum emission
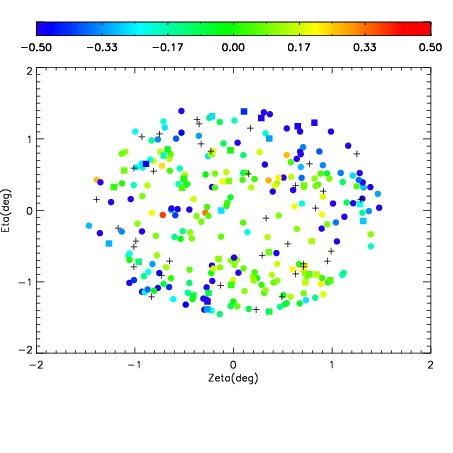
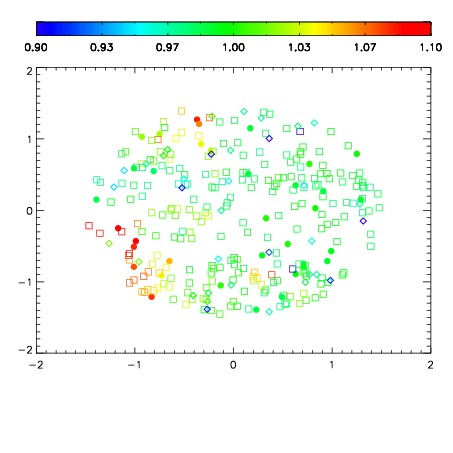
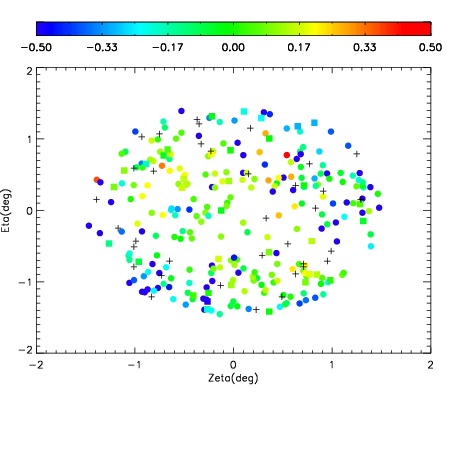
| Spatial sky telluric CO2 absorption deviations (filled: H < 10)
|
| 18480078
| 47
| | Red | Green | Blue
| | z | | 18.85
| | znorm | | 14.67
| | sky | 14.3 | 14.1 | 14.2
| | S/N | 13.9 | 21.2 | 25.2
| | S/N(c) | 12.1 | 21.4 | 35.8
| | SN(E/C) 0.42
|
| 
| 
| 
| 
| 
|
| 18480079
| 47
| | Red | Green | Blue
| | z | | 18.68
| | znorm | | 14.50
| | sky | 14.0 | 14.0 | 14.0
| | S/N | 13.1 | 20.3 | 24.2
| | S/N(c) | 11.4 | 19.8 | 33.0
| | SN(E/C) 0.43
|
| 
| 
| 
| 
| 
|
| 18480080
| 47
| | Red | Green | Blue
| | z | | 18.32
| | znorm | | 14.14
| | sky | 13.7 | 13.7 | 13.6
| | S/N | 10.8 | 17.2 | 20.0
| | S/N(c) | 9.6 | 17.3 | 27.5
| | SN(E/C) 0.50
|
| 
| 
| 
| 
| 
|
| 18480081
| 47
| | Red | Green | Blue
| | z | | 16.73
| | znorm | | 12.55
| | sky | 13.4 | 13.4 | 13.5
| | S/N | 2.9 | 6.0 | 6.6
| | S/N(c) | 3.0 | 6.4 | 10.7
| | SN(E/C) 0.82
|
| 
| 
| 
| 
| 
|
| 18480082
| 47
| | Red | Green | Blue
| | z | | 17.17
| | znorm | | 12.99
| | sky | 13.6 | 13.5 | 13.5
| | S/N | 4.8 | 8.7 | 10.1
| | S/N(c) | 4.5 | 9.4 | 15.5
| | SN(E/C) 0.75
|
| 
| 
| 
| 
| 
|
| 18480083
| 47
| | Red | Green | Blue
| | z | | 17.51
| | znorm | | 13.33
| | sky | 13.6 | 13.5 | 13.5
| | S/N | 6.3 | 11.1 | 12.7
| | S/N(c) | 5.9 | 11.4 | 18.1
| | SN(E/C) 0.68
|
| 
| 
| 
| 
| 
|
| 18480084
| 47
| | Red | Green | Blue
| | z | | 17.77
| | znorm | | 13.59
| | sky | 13.9 | 13.8 | 13.9
| | S/N | 7.7 | 13.4 | 15.1
| | S/N(c) | 7.0 | 13.4 | 21.3
| | SN(E/C) 0.58
|
| 
| 
| 
| 
| 
|
| 18480085
| 47
| | Red | Green | Blue
| | z | | 17.62
| | znorm | | 13.44
| | sky | 13.8 | 13.7 | 13.7
| | S/N | 6.9 | 12.0 | 13.7
| | S/N(c) | 6.6 | 12.3 | 20.1
| | SN(E/C) 0.69
|
| 
| 
| 
| 
| 
|
| 18480086
| 47
| | Red | Green | Blue
| | z | | 17.75
| | znorm | | 13.57
| | sky | 14.2 | 14.2 | 14.2
| | S/N | 7.9 | 13.4 | 15.6
| | S/N(c) | 7.2 | 13.2 | 21.8
| | SN(E/C) 0.59
|
| 
| 
| 
| 
| 
|
| 18480087
| 47
| | Red | Green | Blue
| | z | | 18.51
| | znorm | | 14.33
| | sky | 14.8 | 14.5 | 14.4
| | S/N | 13.2 | 20.9 | 23.9
| | S/N(c) | 11.5 | 20.3 | 31.9
| | SN(E/C) 0.44
|
| 
| 
| 
| 
| 
|