| Red | Green | Blue | |
| z | 17.64 | ||
| znorm | Inf | ||
| sky | -Inf | -Inf | -Inf |
| S/N | 19.5 | 31.7 | 37.8 |
| S/N(c) | 19.0 | 33.9 | 54.2 |
| SN(E/C) |
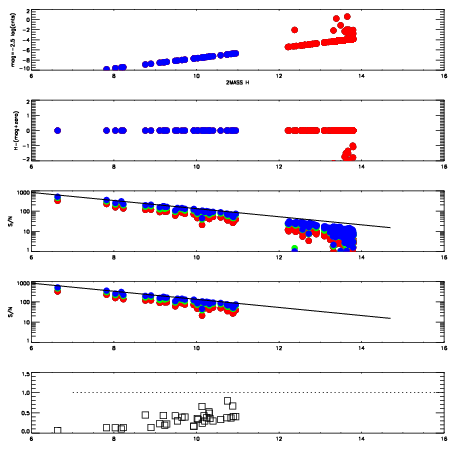
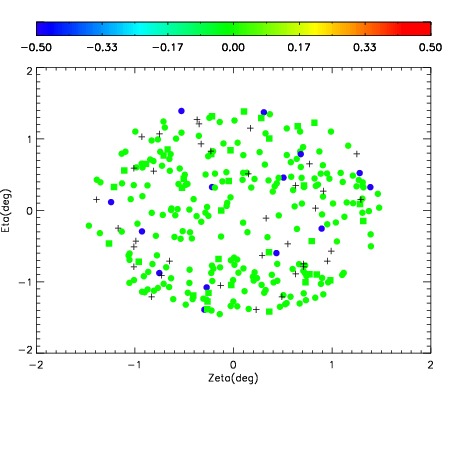
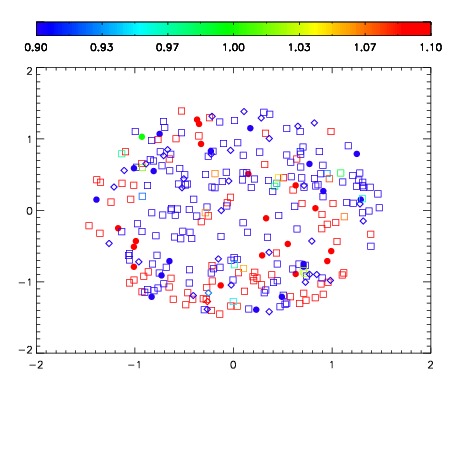


| Frame | Nreads | Zeropoints | Mag plots | Spatial mag deviation | Spatial sky 16325A emission deviations (filled: sky, open: star) | Spatial sky continuum emission | Spatial sky telluric CO2 absorption deviations (filled: H < 10) | |||||||||||||||||||||||
| 0 | 0 |
|
|
|
|
|
|
| IPAIR | NAME | SHIFT | NEWSHIFT | S/N | NAME | SHIFT | NEWSHIFT | S/N |
| 0 | 18480078 | 0.00000 | 0.00000 | 18.7947 | 18480079 | -0.505306 | 0.505306 | 18.6358 |
| 1 | 18480086 | -0.00211384 | 0.00211384 | 17.7260 | 18480087 | -0.507333 | 0.507333 | 18.4739 |
| 2 | 18480085 | -0.00192646 | 0.00192646 | 17.6165 | 18480080 | -0.505146 | 0.505146 | 18.2422 |
| 3 | 18480082 | -0.000934536 | 0.000934536 | 17.1529 | 18480084 | -0.505632 | 0.505632 | 17.7282 |
| 4 | 18480081 | -0.000710265 | 0.000710265 | 16.7097 | 18480083 | -0.505496 | 0.505496 | 17.4550 |