| Red | Green | Blue | |
| z | 17.64 | ||
| znorm | Inf | ||
| sky | -Inf | -NaN | -Inf |
| S/N | 17.2 | 28.2 | 33.3 |
| S/N(c) | 27.5 | 34.1 | 12.3 |
| SN(E/C) |
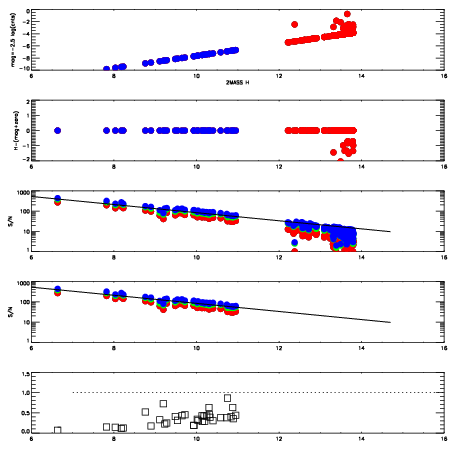
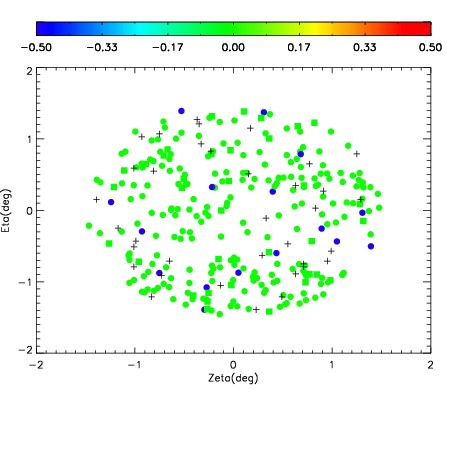
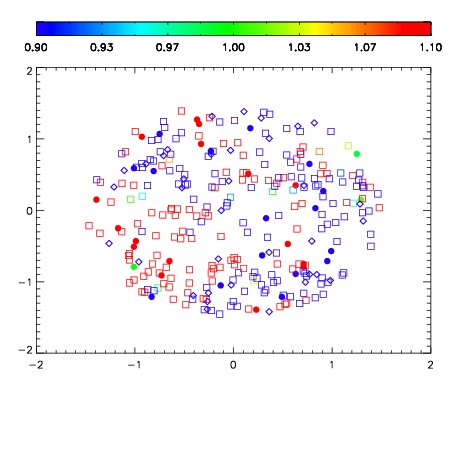
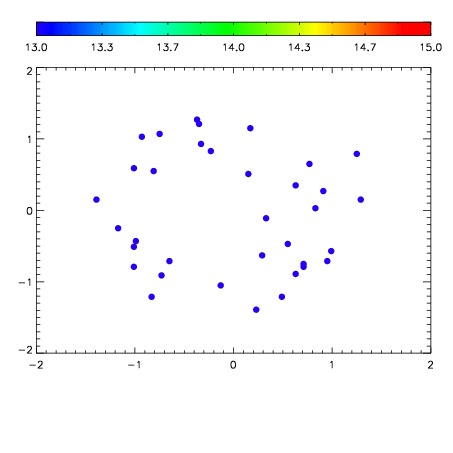

| Frame | Nreads | Zeropoints | Mag plots | Spatial mag deviation | Spatial sky 16325A emission deviations (filled: sky, open: star) | Spatial sky continuum emission | Spatial sky telluric CO2 absorption deviations (filled: H < 10) | |||||||||||||||||||||||
| 0 | 0 |
|
|
|
|
|
|
| IPAIR | NAME | SHIFT | NEWSHIFT | S/N | NAME | SHIFT | NEWSHIFT | S/N |
| 0 | 18550062 | 0.488323 | 0.00000 | 18.6556 | 18550063 | -0.00293270 | 0.491256 | 18.7315 |
| 1 | 18550061 | 0.488090 | 0.000232995 | 18.4539 | 18550060 | 0.00000 | 0.488323 | 18.4820 |