| Red | Green | Blue | |
| z | 17.64 | ||
| znorm | Inf | ||
| sky | -Inf | -NaN | -NaN |
| S/N | 18.3 | 28.3 | 33.3 |
| S/N(c) | 7.4 | 30.0 | 44.3 |
| SN(E/C) |

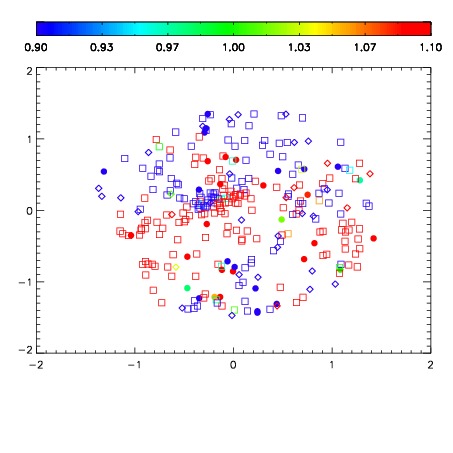


| Frame | Nreads | Zeropoints | Mag plots | Spatial mag deviation | Spatial sky 16325A emission deviations (filled: sky, open: star) | Spatial sky continuum emission | Spatial sky telluric CO2 absorption deviations (filled: H < 10) | |||||||||||||||||||||||
| 0 | 0 |
|
|
|
|
|
|
| IPAIR | NAME | SHIFT | NEWSHIFT | S/N | NAME | SHIFT | NEWSHIFT | S/N |
| 0 | 14750028 | 0.496684 | 0.00000 | 18.5478 | 14750022 | 0.00000 | 0.496684 | 18.5932 |
| 1 | 14750027 | 0.496034 | 0.000650018 | 18.5161 | 14750029 | -0.00143344 | 0.498117 | 18.5614 |
| 2 | 14750024 | 0.496263 | 0.000421017 | 18.4540 | 14750026 | -0.00218064 | 0.498865 | 18.4799 |
| 3 | 14750023 | 0.496112 | 0.000572026 | 18.3668 | 14750025 | -0.00157598 | 0.498260 | 18.4594 |