| Red | Green | Blue | |
| z | 17.65 | ||
| znorm | Inf | ||
| sky | -Inf | -Inf | -Inf |
| S/N | 27.4 | 41.1 | 49.1 |
| S/N(c) | 58.3 | 14.1 | 61.1 |
| SN(E/C) |


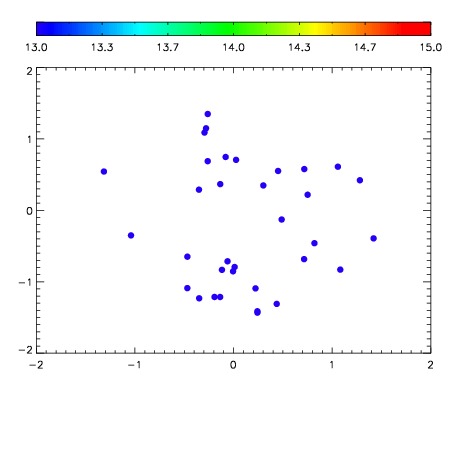

| Frame | Nreads | Zeropoints | Mag plots | Spatial mag deviation | Spatial sky 16325A emission deviations (filled: sky, open: star) | Spatial sky continuum emission | Spatial sky telluric CO2 absorption deviations (filled: H < 10) | |||||||||||||||||||||||
| 0 | 0 |
|
|
|
|
|
|
| IPAIR | NAME | SHIFT | NEWSHIFT | S/N | NAME | SHIFT | NEWSHIFT | S/N |
| 0 | 14990058 | 0.00142270 | 0.00000 | 18.8911 | 14990055 | -0.497458 | 0.498881 | 18.9528 |
| 1 | 14990057 | 0.00107465 | 0.000348050 | 18.9745 | 14990059 | -0.500905 | 0.502328 | 19.0469 |
| 2 | 14990061 | -0.00307500 | 0.00449770 | 18.9473 | 14990056 | -0.497866 | 0.499289 | 18.9538 |
| 3 | 14990054 | 0.00000 | 0.00142270 | 18.8445 | 14990060 | -0.500331 | 0.501754 | 18.9468 |