| Red | Green | Blue | |
| z | 17.64 | ||
| znorm | Inf | ||
| sky | -Inf | -Inf | -Inf |
| S/N | 13.5 | 22.2 | 26.4 |
| S/N(c) | 36.0 | 9.6 | 23.2 |
| SN(E/C) |
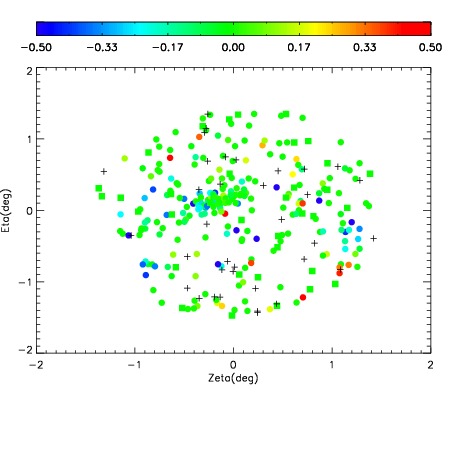
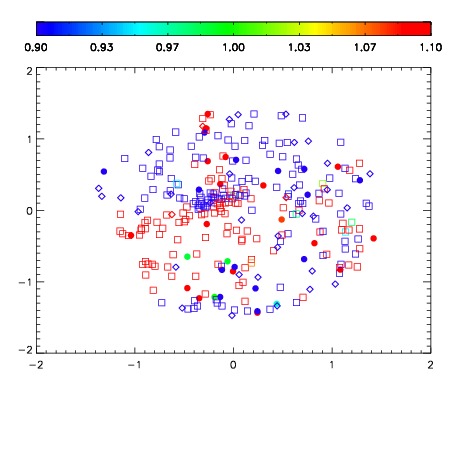


| Frame | Nreads | Zeropoints | Mag plots | Spatial mag deviation | Spatial sky 16325A emission deviations (filled: sky, open: star) | Spatial sky continuum emission | Spatial sky telluric CO2 absorption deviations (filled: H < 10) | |||||||||||||||||||||||
| 0 | 0 |
|
|
|
|
|
|
| IPAIR | NAME | SHIFT | NEWSHIFT | S/N | NAME | SHIFT | NEWSHIFT | S/N |
| 0 | 15190043 | 0.00113417 | 0.00000 | 18.4023 | 15190041 | -0.506920 | 0.508054 | 18.3964 |
| 1 | 15190039 | 0.00000 | 0.00113417 | 18.2086 | 15190044 | -0.507346 | 0.508480 | 18.1634 |
| 2 | 15190042 | 0.000687324 | 0.000446846 | 18.1167 | 15190040 | -0.507065 | 0.508199 | 18.1282 |