| Red | Green | Blue | |
| z | 17.64 | ||
| znorm | Inf | ||
| sky | -Inf | -Inf | -Inf |
| S/N | 25.5 | 38.1 | 45.9 |
| S/N(c) | 64.4 | 16.5 | 40.5 |
| SN(E/C) |
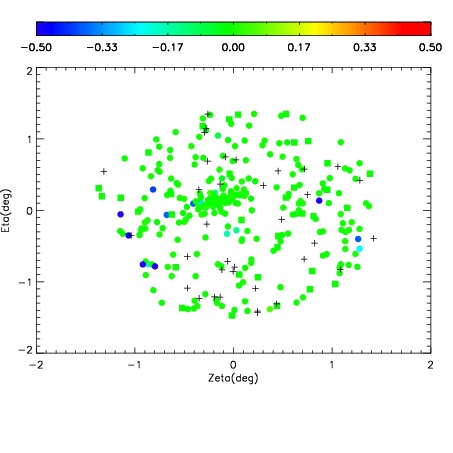


| Frame | Nreads | Zeropoints | Mag plots | Spatial mag deviation | Spatial sky 16325A emission deviations (filled: sky, open: star) | Spatial sky continuum emission | Spatial sky telluric CO2 absorption deviations (filled: H < 10) | |||||||||||||||||||||||
| 0 | 0 |
|
|
|
|
|
|
| IPAIR | NAME | SHIFT | NEWSHIFT | S/N | NAME | SHIFT | NEWSHIFT | S/N |
| 0 | 15200030 | 0.000198650 | 0.00000 | 18.9806 | 15200031 | -0.508238 | 0.508437 | 19.0383 |
| 1 | 15200029 | -0.000316757 | 0.000515407 | 18.8323 | 15200028 | -0.508032 | 0.508231 | 18.7962 |
| 2 | 15200022 | 0.00000 | 0.000198650 | 18.8075 | 15200027 | -0.507487 | 0.507686 | 18.7455 |
| 3 | 15200026 | -0.000624735 | 0.000823385 | 18.7583 | 15200024 | -0.507574 | 0.507773 | 18.6517 |
| 4 | 15200025 | -0.000386711 | 0.000585361 | 18.7127 | 15200023 | -0.507304 | 0.507503 | 18.5890 |