| Red | Green | Blue | |
| z | 17.63 | ||
| znorm | Inf | ||
| sky | -Inf | -NaN | -NaN |
| S/N | 22.7 | 35.3 | 43.0 |
| S/N(c) | 16.5 | 12.7 | 52.3 |
| SN(E/C) |


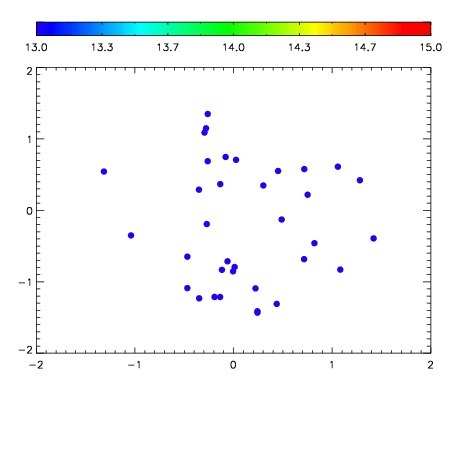

| Frame | Nreads | Zeropoints | Mag plots | Spatial mag deviation | Spatial sky 16325A emission deviations (filled: sky, open: star) | Spatial sky continuum emission | Spatial sky telluric CO2 absorption deviations (filled: H < 10) | |||||||||||||||||||||||
| 0 | 0 |
|
|
|
|
|
|
| IPAIR | NAME | SHIFT | NEWSHIFT | S/N | NAME | SHIFT | NEWSHIFT | S/N |
| 0 | 15250076 | 0.509751 | 0.00000 | 18.8424 | 15250073 | 0.00109233 | 0.508659 | 18.8410 |
| 1 | 15250072 | 0.508386 | 0.00136501 | 18.7822 | 15250077 | 0.00141781 | 0.508333 | 18.7984 |
| 2 | 15250075 | 0.509314 | 0.000437021 | 18.7675 | 15250074 | 0.00117687 | 0.508574 | 18.7834 |
| 3 | 15250071 | 0.507735 | 0.00201601 | 18.7124 | 15250070 | 0.00000 | 0.509751 | 18.6566 |