| Red | Green | Blue | |
| z | 17.64 | ||
| znorm | Inf | ||
| sky | -Inf | -Inf | -NaN |
| S/N | 15.7 | 25.3 | 31.0 |
| S/N(c) | 17.6 | 13.4 | 33.3 |
| SN(E/C) |
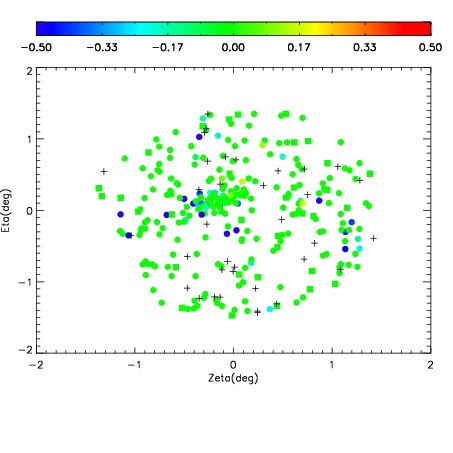
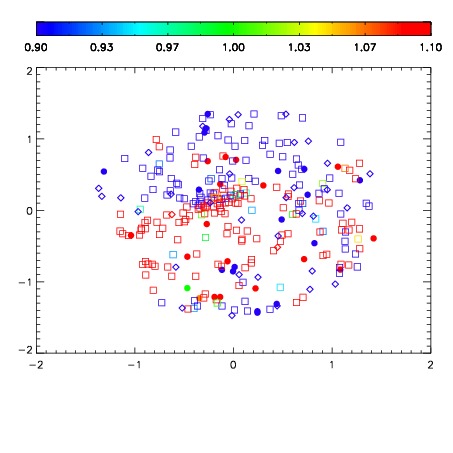
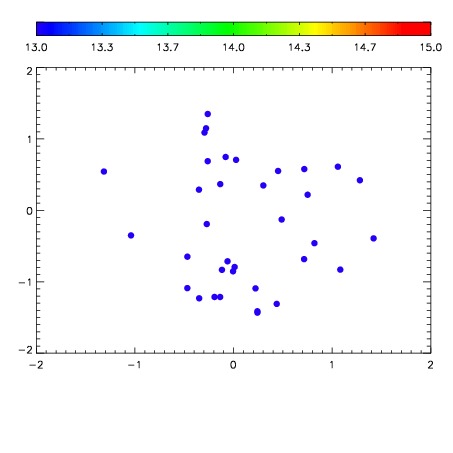

| Frame | Nreads | Zeropoints | Mag plots | Spatial mag deviation | Spatial sky 16325A emission deviations (filled: sky, open: star) | Spatial sky continuum emission | Spatial sky telluric CO2 absorption deviations (filled: H < 10) | |||||||||||||||||||||||
| 0 | 0 |
|
|
|
|
|
|
| IPAIR | NAME | SHIFT | NEWSHIFT | S/N | NAME | SHIFT | NEWSHIFT | S/N |
| 0 | 15470061 | 0.496703 | 0.00000 | 18.6796 | 15470063 | -0.000908512 | 0.497612 | 18.7086 |
| 1 | 15470065 | 0.493731 | 0.00297201 | 18.8997 | 15470067 | -0.00185018 | 0.498553 | 18.9320 |
| 2 | 15470066 | 0.493841 | 0.00286201 | 18.8750 | 15470064 | -0.00135087 | 0.498054 | 18.8739 |
| 3 | 15470062 | 0.496656 | 4.69983e-05 | 18.5113 | 15470060 | 0.00000 | 0.496703 | 18.6671 |