| Red | Green | Blue | |
| z | 17.64 | ||
| znorm | Inf | ||
| sky | -Inf | -Inf | -Inf |
| S/N | 27.2 | 50.0 | 55.0 |
| S/N(c) | 0.0 | 0.0 | 0.0 |
| SN(E/C) |
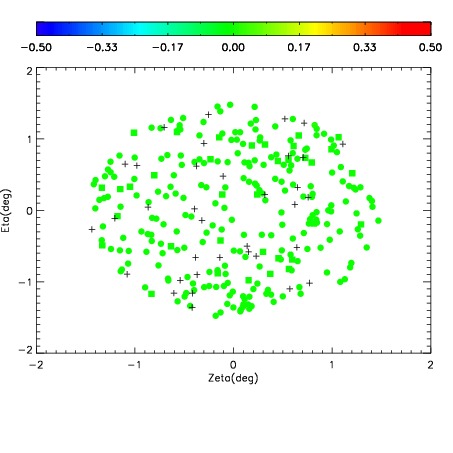
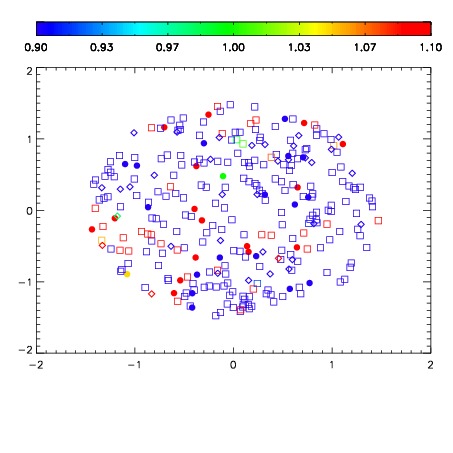
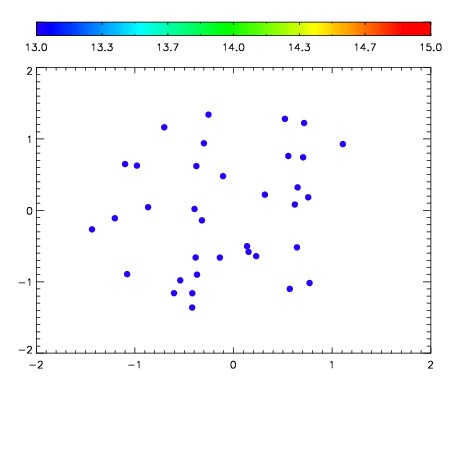

| Frame | Nreads | Zeropoints | Mag plots | Spatial mag deviation | Spatial sky 16325A emission deviations (filled: sky, open: star) | Spatial sky continuum emission | Spatial sky telluric CO2 absorption deviations (filled: H < 10) | |||||||||||||||||||||||
| 0 | 0 |
|
|
|
|
|
|
| IPAIR | NAME | SHIFT | NEWSHIFT | S/N | NAME | SHIFT | NEWSHIFT | S/N |
| 0 | 15980055 | 0.00376030 | 0.00000 | 17.7126 | 15980056 | -0.483330 | 0.487090 | 17.6810 |
| 1 | 15980042 | 0.00144236 | 0.00231794 | 18.5488 | 15980041 | -0.487138 | 0.490898 | 18.5520 |
| 2 | 15980054 | 0.00269664 | 0.00106366 | 18.5300 | 15980053 | -0.484880 | 0.488640 | 18.4922 |
| 3 | 15980051 | 0.00148264 | 0.00227766 | 18.5250 | 15980040 | -0.488415 | 0.492175 | 18.4299 |
| 4 | 15980039 | 0.00000 | 0.00376030 | 18.4026 | 15980052 | -0.483870 | 0.487630 | 18.3787 |
| 5 | 15980047 | 0.00313349 | 0.000626810 | 18.3886 | 15980045 | -0.487537 | 0.491297 | 18.3334 |
| 6 | 15980046 | 0.00209325 | 0.00166705 | 18.2315 | 15980048 | -0.485487 | 0.489247 | 18.3085 |
| 7 | 15980043 | 0.00256261 | 0.00119769 | 18.2013 | 15980044 | -0.487945 | 0.491705 | 18.1564 |
| 8 | 15980050 | 0.00242484 | 0.00133546 | 17.8972 | 15980049 | -0.487266 | 0.491026 | 17.8720 |