| Red | Green | Blue | |
| z | 17.64 | ||
| znorm | Inf | ||
| sky | -Inf | -Inf | -Inf |
| S/N | 21.7 | 38.8 | 43.5 |
| S/N(c) | 0.0 | 0.0 | 0.0 |
| SN(E/C) |
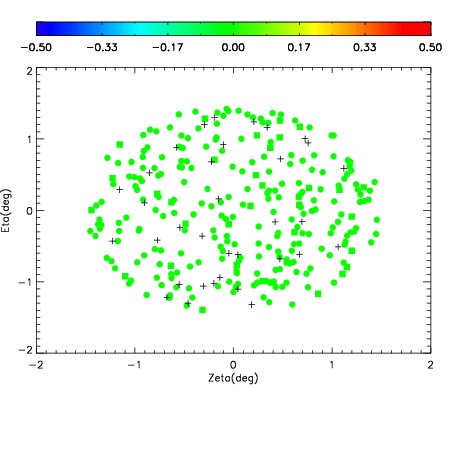
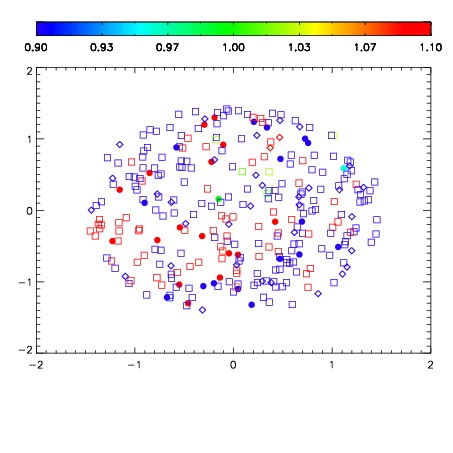
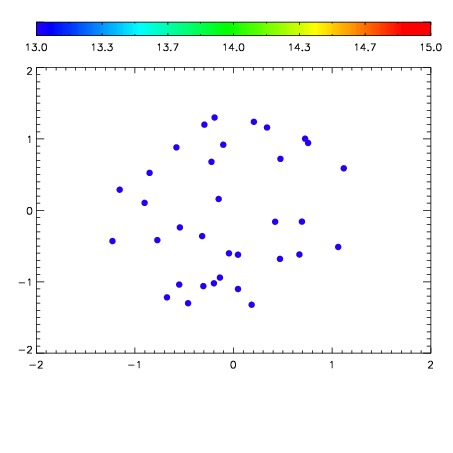

| Frame | Nreads | Zeropoints | Mag plots | Spatial mag deviation | Spatial sky 16325A emission deviations (filled: sky, open: star) | Spatial sky continuum emission | Spatial sky telluric CO2 absorption deviations (filled: H < 10) | |||||||||||||||||||||||
| 0 | 0 |
|
|
|
|
|
|
| IPAIR | NAME | SHIFT | NEWSHIFT | S/N | NAME | SHIFT | NEWSHIFT | S/N |
| 0 | 16030049 | 0.00292465 | 0.00000 | 17.7414 | 16030048 | -0.484026 | 0.486951 | 17.8158 |
| 1 | 16030045 | 0.00184863 | 0.00107602 | 18.4294 | 16030047 | -0.483723 | 0.486648 | 18.4416 |
| 2 | 16030041 | 0.00215841 | 0.000766240 | 18.3741 | 16030039 | -0.487346 | 0.490271 | 18.3817 |
| 3 | 16030038 | 0.00000 | 0.00292465 | 18.3685 | 16030044 | -0.484922 | 0.487847 | 18.3299 |
| 4 | 16030046 | 0.00277558 | 0.000149070 | 18.2598 | 16030040 | -0.486962 | 0.489887 | 18.1796 |
| 5 | 16030042 | 0.00256923 | 0.000355420 | 18.1580 | 16030043 | -0.485088 | 0.488013 | 18.0174 |