| Red | Green | Blue | |
| z | 17.64 | ||
| znorm | Inf | ||
| sky | -Inf | -NaN | -NaN |
| S/N | 20.4 | 35.4 | 36.6 |
| S/N(c) | 0.0 | 0.0 | 0.0 |
| SN(E/C) |
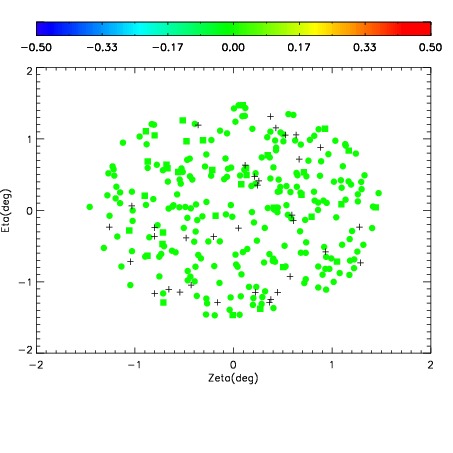

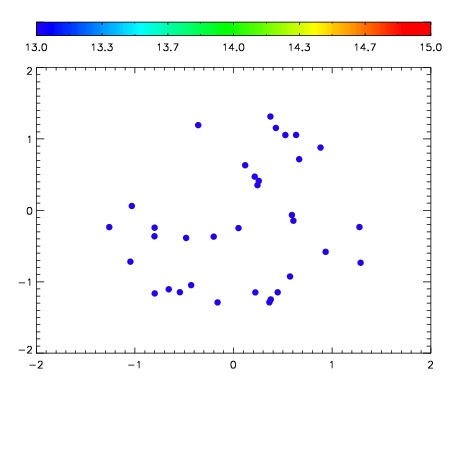

| Frame | Nreads | Zeropoints | Mag plots | Spatial mag deviation | Spatial sky 16325A emission deviations (filled: sky, open: star) | Spatial sky continuum emission | Spatial sky telluric CO2 absorption deviations (filled: H < 10) | |||||||||||||||||||||||
| 0 | 0 |
|
|
|
|
|
|
| IPAIR | NAME | SHIFT | NEWSHIFT | S/N | NAME | SHIFT | NEWSHIFT | S/N |
| 0 | 15870012 | 0.489978 | 0.00000 | 18.1178 | 15870010 | 0.00000 | 0.489978 | 18.1093 |
| 1 | 15870015 | 0.488444 | 0.00153399 | 18.7606 | 15870014 | 5.70755e-07 | 0.489977 | 18.7179 |
| 2 | 15870011 | 0.489280 | 0.000698000 | 18.1262 | 15870013 | 0.00130147 | 0.488677 | 18.1302 |