| Red | Green | Blue | |
| z | 17.64 | ||
| znorm | Inf | ||
| sky | -NaN | -NaN | -Inf |
| S/N | 27.9 | 48.4 | 50.2 |
| S/N(c) | 0.0 | 0.0 | 0.0 |
| SN(E/C) |
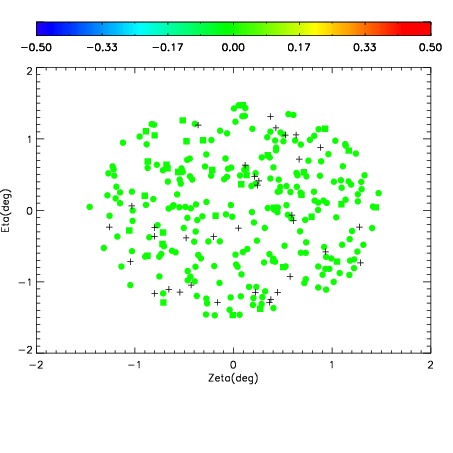
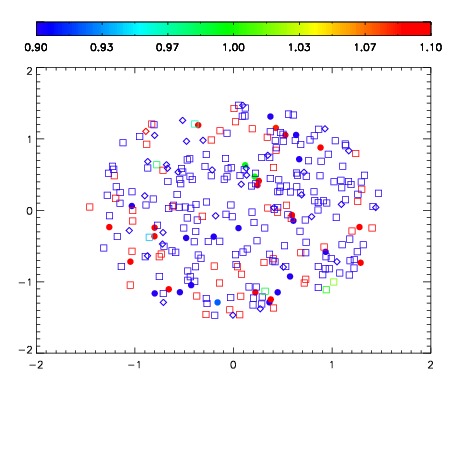
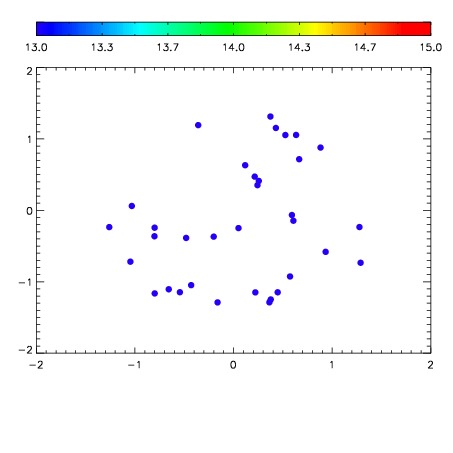

| Frame | Nreads | Zeropoints | Mag plots | Spatial mag deviation | Spatial sky 16325A emission deviations (filled: sky, open: star) | Spatial sky continuum emission | Spatial sky telluric CO2 absorption deviations (filled: H < 10) | |||||||||||||||||||||||
| 0 | 0 |
|
|
|
|
|
|
| IPAIR | NAME | SHIFT | NEWSHIFT | S/N | NAME | SHIFT | NEWSHIFT | S/N |
| 0 | 15880020 | 0.489523 | 0.00000 | 18.2321 | 15880019 | 0.00291049 | 0.486612 | 18.2433 |
| 1 | 15880016 | 0.486885 | 0.00263798 | 18.8476 | 15880022 | 0.000935938 | 0.488587 | 18.7074 |
| 2 | 15880021 | 0.488284 | 0.00123900 | 18.7238 | 15880015 | -0.000182347 | 0.489705 | 18.6564 |
| 3 | 15880017 | 0.487790 | 0.00173301 | 18.1399 | 15880018 | 0.00155797 | 0.487965 | 18.1349 |
| 4 | 15880013 | 0.488944 | 0.000579000 | 18.0133 | 15880014 | 0.000410595 | 0.489112 | 18.0452 |
| 5 | 15880012 | 0.487603 | 0.00191998 | 17.9122 | 15880011 | 0.00000 | 0.489523 | 17.9204 |