| Red | Green | Blue | |
| z | 17.64 | ||
| znorm | Inf | ||
| sky | -Inf | -Inf | -Inf |
| S/N | 14.3 | 27.2 | 26.8 |
| S/N(c) | 0.0 | 0.0 | 0.0 |
| SN(E/C) |
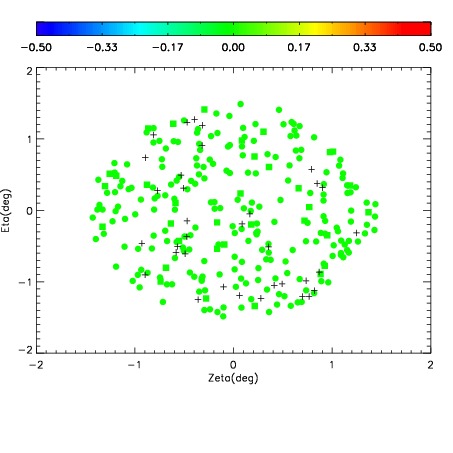

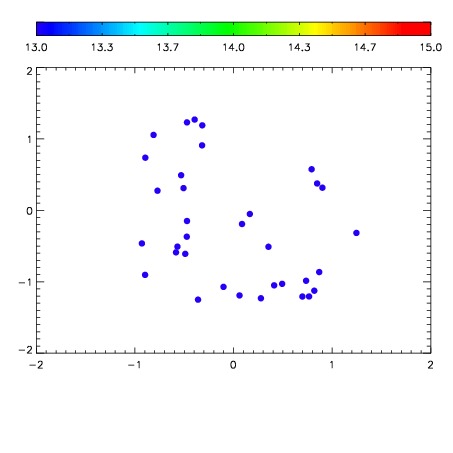

| Frame | Nreads | Zeropoints | Mag plots | Spatial mag deviation | Spatial sky 16325A emission deviations (filled: sky, open: star) | Spatial sky continuum emission | Spatial sky telluric CO2 absorption deviations (filled: H < 10) | |||||||||||||||||||||||
| 0 | 0 |
|
|
|
|
|
|
| IPAIR | NAME | SHIFT | NEWSHIFT | S/N | NAME | SHIFT | NEWSHIFT | S/N |
| 0 | 15050042 | 0.00721693 | 0.00000 | 18.1788 | 15050040 | -0.493138 | 0.500355 | 18.3780 |
| 1 | 15050041 | 0.00707921 | 0.000137720 | 18.4980 | 15050039 | -0.493607 | 0.500824 | 18.4154 |
| 2 | 15050038 | 0.00000 | 0.00721693 | 18.0787 | 15050043 | -0.492002 | 0.499219 | 18.0980 |