| Red | Green | Blue | |
| z | 17.64 | ||
| znorm | Inf | ||
| sky | -Inf | -Inf | -Inf |
| S/N | 14.0 | 28.1 | 26.7 |
| S/N(c) | 0.0 | 0.0 | 0.0 |
| SN(E/C) |
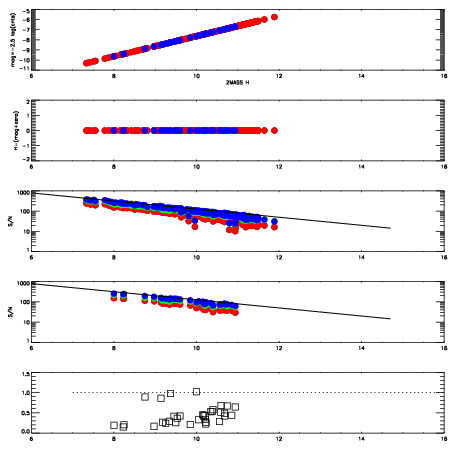
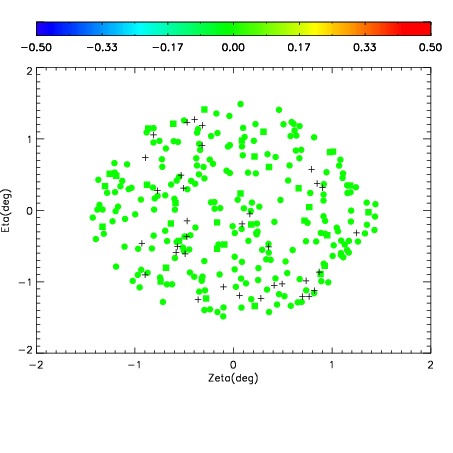
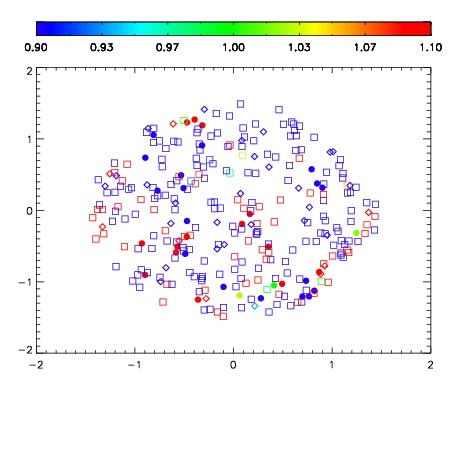
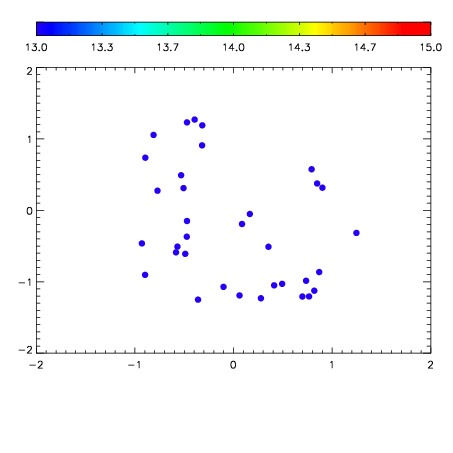

| Frame | Nreads | Zeropoints | Mag plots | Spatial mag deviation | Spatial sky 16325A emission deviations (filled: sky, open: star) | Spatial sky continuum emission | Spatial sky telluric CO2 absorption deviations (filled: H < 10) | |||||||||||||||||||||||
| 0 | 0 |
|
|
|
|
|
|
| IPAIR | NAME | SHIFT | NEWSHIFT | S/N | NAME | SHIFT | NEWSHIFT | S/N |
| 0 | 15080017 | 0.500995 | 0.00000 | 18.0934 | 15080018 | -0.000558989 | 0.501554 | 18.1190 |
| 1 | 15080012 | 0.500653 | 0.000341952 | 18.0036 | 15080019 | -0.000983094 | 0.501978 | 18.0455 |
| 2 | 15080020 | 0.500166 | 0.000828981 | 17.9537 | 15080014 | -0.000586009 | 0.501581 | 17.9198 |
| 3 | 15080016 | 0.500828 | 0.000166953 | 17.8126 | 15080011 | 0.00000 | 0.500995 | 17.8160 |
| 4 | 15080013 | 0.500914 | 8.10027e-05 | 17.7539 | 15080015 | -0.000862231 | 0.501857 | 17.7659 |