| Red | Green | Blue | |
| z | 17.64 | ||
| znorm | Inf | ||
| sky | -NaN | -Inf | -Inf |
| S/N | 22.2 | 43.6 | 43.7 |
| S/N(c) | 0.0 | 0.0 | 0.0 |
| SN(E/C) |
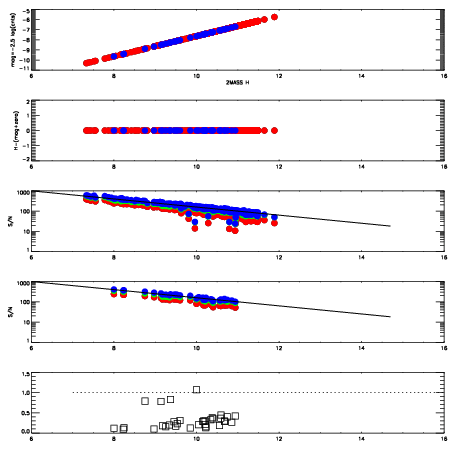
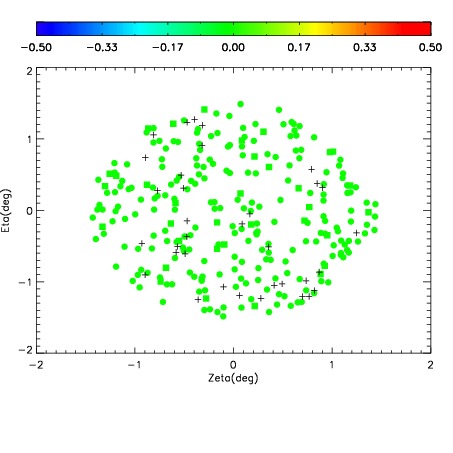
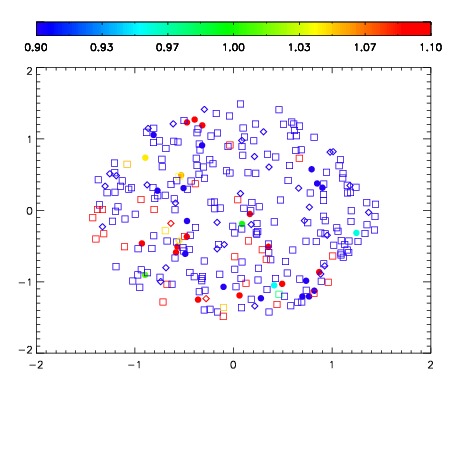
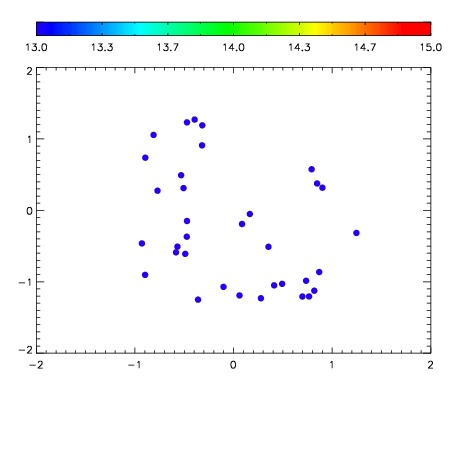

| Frame | Nreads | Zeropoints | Mag plots | Spatial mag deviation | Spatial sky 16325A emission deviations (filled: sky, open: star) | Spatial sky continuum emission | Spatial sky telluric CO2 absorption deviations (filled: H < 10) | |||||||||||||||||||||||
| 0 | 0 |
|
|
|
|
|
|
| IPAIR | NAME | SHIFT | NEWSHIFT | S/N | NAME | SHIFT | NEWSHIFT | S/N |
| 0 | 15090038 | 0.00382668 | 0.00000 | 18.4741 | 15090039 | -0.495525 | 0.499352 | 18.4373 |
| 1 | 15090033 | -0.00127371 | 0.00510039 | 18.6172 | 15090040 | -0.495672 | 0.499499 | 18.6039 |
| 2 | 15090041 | 0.00376573 | 6.09499e-05 | 18.5708 | 15090032 | -0.497367 | 0.501194 | 18.5058 |
| 3 | 15090026 | 0.00000 | 0.00382668 | 18.4489 | 15090027 | -0.499523 | 0.503350 | 18.4365 |
| 4 | 15090034 | -4.63711e-05 | 0.00387305 | 18.3431 | 15090035 | -0.496650 | 0.500477 | 18.3678 |
| 5 | 15090030 | 0.000709066 | 0.00311761 | 18.2827 | 15090031 | -0.497941 | 0.501768 | 18.3159 |
| 6 | 15090029 | 0.000520116 | 0.00330656 | 18.2159 | 15090028 | -0.499177 | 0.503004 | 18.1976 |
| 7 | 15090037 | 0.00302113 | 0.000805550 | 18.2067 | 15090036 | -0.496426 | 0.500253 | 18.1486 |