| Red | Green | Blue | |
| z | 17.64 | ||
| znorm | Inf | ||
| sky | -NaN | -Inf | -Inf |
| S/N | 25.3 | 45.8 | 50.7 |
| S/N(c) | 0.0 | 0.0 | 0.0 |
| SN(E/C) |
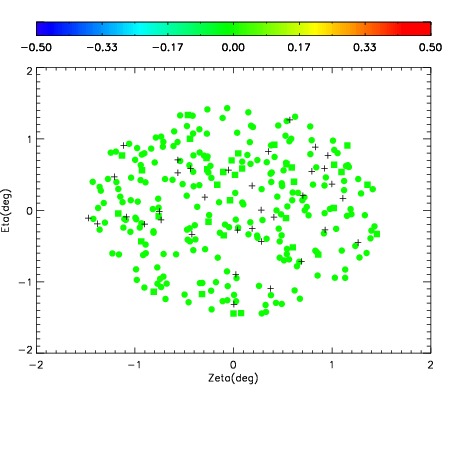
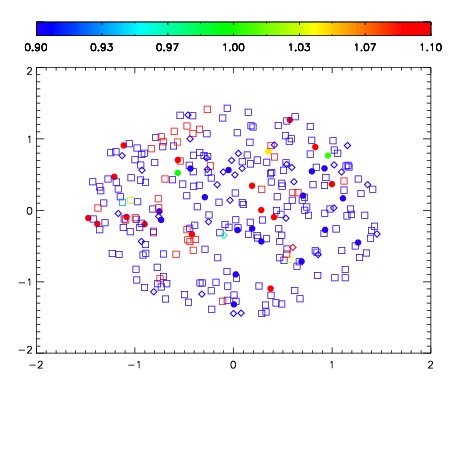
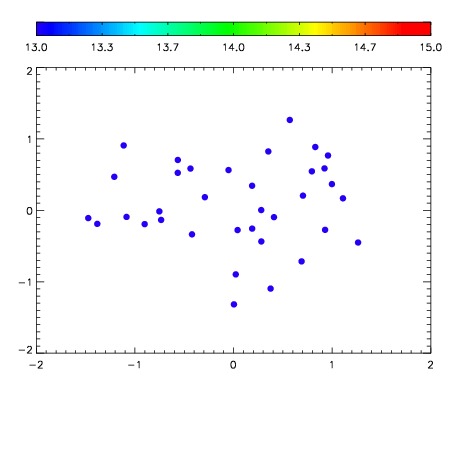

| Frame | Nreads | Zeropoints | Mag plots | Spatial mag deviation | Spatial sky 16325A emission deviations (filled: sky, open: star) | Spatial sky continuum emission | Spatial sky telluric CO2 absorption deviations (filled: H < 10) | |||||||||||||||||||||||
| 0 | 0 |
|
|
|
|
|
|
| IPAIR | NAME | SHIFT | NEWSHIFT | S/N | NAME | SHIFT | NEWSHIFT | S/N |
| 0 | 15910034 | 0.00134920 | 0.00000 | 18.3229 | 15910032 | -0.489796 | 0.491145 | 18.3250 |
| 1 | 15910030 | -0.000217178 | 0.00156638 | 18.6417 | 15910031 | -0.490553 | 0.491902 | 18.6610 |
| 2 | 15910037 | -0.000645776 | 0.00199498 | 18.5224 | 15910036 | -0.489813 | 0.491162 | 18.6206 |
| 3 | 15910033 | 0.000558990 | 0.000790210 | 18.4162 | 15910035 | -0.489770 | 0.491119 | 18.4043 |
| 4 | 15910029 | -4.82132e-05 | 0.00139741 | 18.1648 | 15910027 | -0.490139 | 0.491488 | 18.2071 |
| 5 | 15910026 | 0.00000 | 0.00134920 | 18.0662 | 15910028 | -0.489855 | 0.491204 | 18.1412 |