| Red | Green | Blue | |
| z | 17.64 | ||
| znorm | Inf | ||
| sky | -Inf | -Inf | -Inf |
| S/N | 26.4 | 48.7 | 49.9 |
| S/N(c) | 0.0 | 0.0 | 0.0 |
| SN(E/C) |
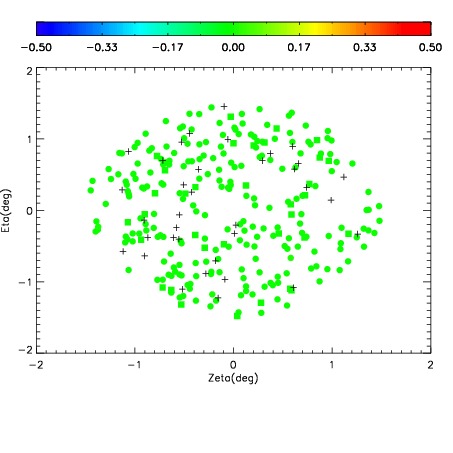
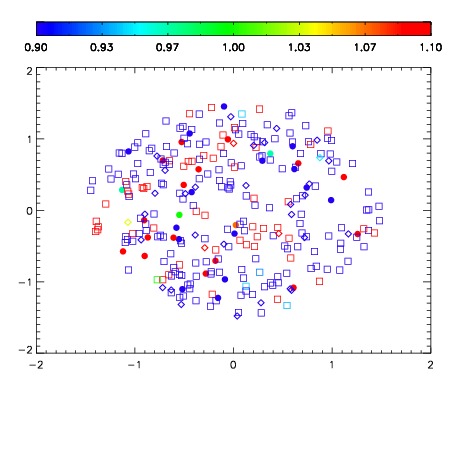


| Frame | Nreads | Zeropoints | Mag plots | Spatial mag deviation | Spatial sky 16325A emission deviations (filled: sky, open: star) | Spatial sky continuum emission | Spatial sky telluric CO2 absorption deviations (filled: H < 10) | |||||||||||||||||||||||
| 0 | 0 |
|
|
|
|
|
|
| IPAIR | NAME | SHIFT | NEWSHIFT | S/N | NAME | SHIFT | NEWSHIFT | S/N |
| 0 | 15680046 | 0.495105 | 0.00000 | 18.3691 | 15680043 | 0.000941914 | 0.494163 | 18.3329 |
| 1 | 15680037 | 0.491536 | 0.00356901 | 18.6570 | 15680036 | 0.00165670 | 0.493448 | 18.6486 |
| 2 | 15680045 | 0.493733 | 0.00137201 | 18.5108 | 15680044 | 0.000841356 | 0.494264 | 18.5194 |
| 3 | 15680042 | 0.492280 | 0.00282499 | 18.4418 | 15680039 | 0.000226298 | 0.494879 | 18.4599 |
| 4 | 15680038 | 0.492289 | 0.00281599 | 18.4265 | 15680047 | 0.00232339 | 0.492782 | 18.4273 |
| 5 | 15680041 | 0.492926 | 0.00217900 | 18.2775 | 15680048 | 0.00305788 | 0.492047 | 18.2640 |
| 6 | 15680049 | 0.493133 | 0.00197199 | 18.2006 | 15680040 | 0.000984791 | 0.494120 | 18.2344 |
| 7 | 15680033 | 0.492880 | 0.00222501 | 18.0895 | 15680035 | 0.00217700 | 0.492928 | 18.1438 |
| 8 | 15680034 | 0.493566 | 0.00153899 | 18.0131 | 15680032 | 0.00000 | 0.495105 | 18.1021 |