| Red | Green | Blue | |
| z | 17.64 | ||
| znorm | Inf | ||
| sky | -Inf | -NaN | -Inf |
| S/N | 35.5 | 62.0 | 62.8 |
| S/N(c) | 0.0 | 0.0 | 0.0 |
| SN(E/C) |
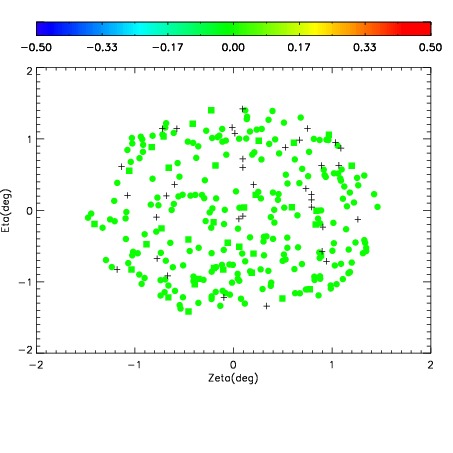
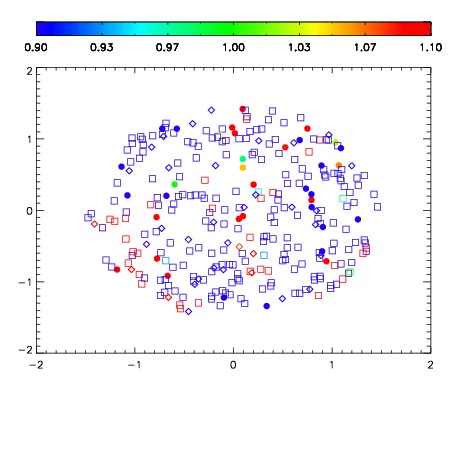


| Frame | Nreads | Zeropoints | Mag plots | Spatial mag deviation | Spatial sky 16325A emission deviations (filled: sky, open: star) | Spatial sky continuum emission | Spatial sky telluric CO2 absorption deviations (filled: H < 10) | |||||||||||||||||||||||
| 0 | 0 |
|
|
|
|
|
|
| IPAIR | NAME | SHIFT | NEWSHIFT | S/N | NAME | SHIFT | NEWSHIFT | S/N |
| 0 | 15460061 | 0.494595 | 0.00000 | 17.6427 | 15460059 | 0.00000 | 0.494595 | 17.9683 |
| 1 | 15460065 | 0.491985 | 0.00261000 | 18.4892 | 15460078 | -0.00448382 | 0.499079 | 18.5432 |
| 2 | 15460064 | 0.491253 | 0.00334200 | 18.4053 | 15460071 | -0.00327561 | 0.497871 | 18.5120 |
| 3 | 15460084 | 0.489697 | 0.00489798 | 18.3433 | 15460079 | -0.00427741 | 0.498872 | 18.3376 |
| 4 | 15460072 | 0.490987 | 0.00360799 | 18.3094 | 15460063 | -0.000947632 | 0.495543 | 18.3026 |
| 5 | 15460068 | 0.491531 | 0.00306398 | 18.2751 | 15460074 | -0.00298941 | 0.497584 | 18.2739 |
| 6 | 15460060 | 0.493520 | 0.00107500 | 18.2731 | 15460083 | -0.00456881 | 0.499164 | 18.2499 |
| 7 | 15460080 | 0.490219 | 0.00437599 | 18.1633 | 15460067 | -0.00143996 | 0.496035 | 18.1737 |
| 8 | 15460069 | 0.491406 | 0.00318900 | 18.1274 | 15460070 | -0.00256573 | 0.497161 | 18.0494 |
| 9 | 15460077 | 0.491143 | 0.00345200 | 18.0592 | 15460066 | -0.00108346 | 0.495678 | 18.0452 |
| 10 | 15460073 | 0.492111 | 0.00248399 | 17.5803 | 15460062 | -0.000301173 | 0.494896 | 17.9614 |
| 11 | 15460081 | 0.490255 | 0.00433999 | 17.2140 | 15460082 | -0.00432006 | 0.498915 | 17.0887 |
| 12 | 15460076 | 0.491647 | 0.00294799 | 17.0488 | 15460075 | -0.00254520 | 0.497140 | 16.6000 |