| Red | Green | Blue | |
| z | 17.64 | ||
| znorm | Inf | ||
| sky | -NaN | -NaN | -NaN |
| S/N | 18.7 | 31.8 | 33.2 |
| S/N(c) | 0.0 | 0.0 | 0.0 |
| SN(E/C) |
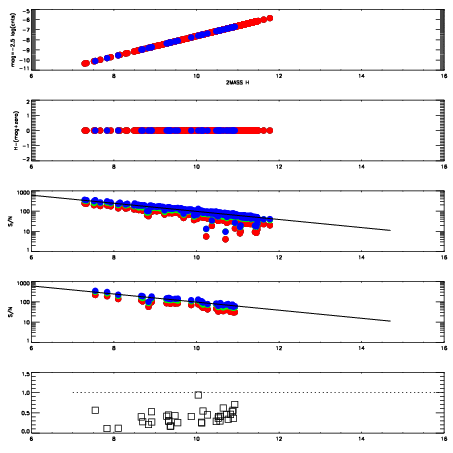


| Frame | Nreads | Zeropoints | Mag plots | Spatial mag deviation | Spatial sky 16325A emission deviations (filled: sky, open: star) | Spatial sky continuum emission | Spatial sky telluric CO2 absorption deviations (filled: H < 10) | |||||||||||||||||||||||
| 0 | 0 |
|
|
|
|
|
|
| IPAIR | NAME | SHIFT | NEWSHIFT | S/N | NAME | SHIFT | NEWSHIFT | S/N |
| 0 | 15470073 | 0.495064 | 0.00000 | 18.2870 | 15470074 | 0.000390252 | 0.494674 | 18.3471 |
| 1 | 15470072 | 0.493321 | 0.00174299 | 18.6487 | 15470071 | 0.00000 | 0.495064 | 18.5587 |
| 2 | 15470076 | 0.492192 | 0.00287199 | 18.2554 | 15470075 | -0.00112622 | 0.496190 | 18.2139 |