| Red | Green | Blue | |
| z | 17.64 | ||
| znorm | Inf | ||
| sky | -Inf | -Inf | -NaN |
| S/N | 18.2 | 31.3 | 33.5 |
| S/N(c) | 0.0 | 0.0 | 0.0 |
| SN(E/C) |
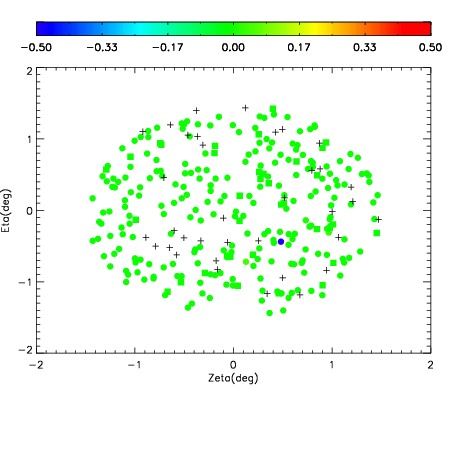
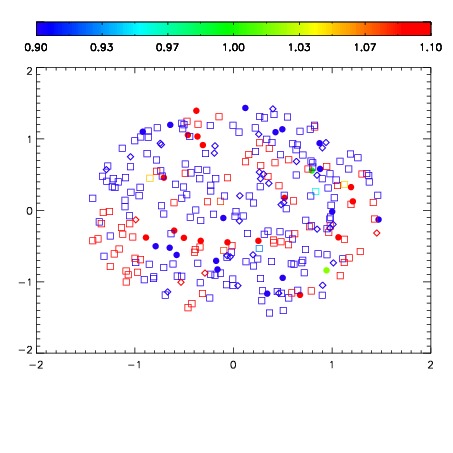


| Frame | Nreads | Zeropoints | Mag plots | Spatial mag deviation | Spatial sky 16325A emission deviations (filled: sky, open: star) | Spatial sky continuum emission | Spatial sky telluric CO2 absorption deviations (filled: H < 10) | |||||||||||||||||||||||
| 0 | 0 |
|
|
|
|
|
|
| IPAIR | NAME | SHIFT | NEWSHIFT | S/N | NAME | SHIFT | NEWSHIFT | S/N |
| 0 | 15100044 | 0.500216 | 0.00000 | 18.2304 | 15100051 | 0.00274193 | 0.497474 | 18.2449 |
| 1 | 15100043 | 0.499702 | 0.000514001 | 18.3860 | 15100042 | 0.00000 | 0.500216 | 18.3645 |
| 2 | 15100049 | 0.499545 | 0.000670999 | 18.3045 | 15100048 | 0.00101740 | 0.499199 | 18.3006 |
| 3 | 15100050 | 0.499816 | 0.000400007 | 18.2813 | 15100045 | 2.60231e-05 | 0.500190 | 18.2602 |