| Red | Green | Blue | |
| z | 17.64 | ||
| znorm | Inf | ||
| sky | -Inf | -Inf | -NaN |
| S/N | 16.4 | 29.0 | 31.2 |
| S/N(c) | 0.0 | 0.0 | 0.0 |
| SN(E/C) |

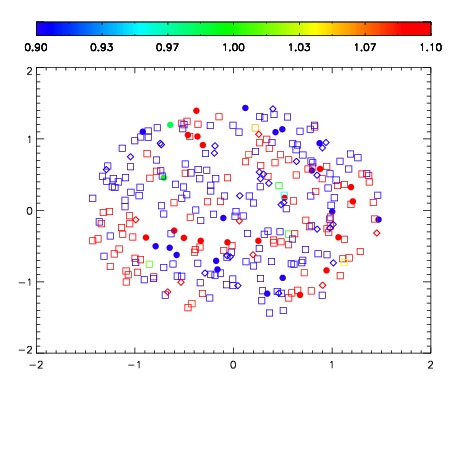


| Frame | Nreads | Zeropoints | Mag plots | Spatial mag deviation | Spatial sky 16325A emission deviations (filled: sky, open: star) | Spatial sky continuum emission | Spatial sky telluric CO2 absorption deviations (filled: H < 10) | |||||||||||||||||||||||
| 0 | 0 |
|
|
|
|
|
|
| IPAIR | NAME | SHIFT | NEWSHIFT | S/N | NAME | SHIFT | NEWSHIFT | S/N |
| 0 | 15110048 | 0.515834 | 0.00000 | 18.3156 | 15110046 | 0.00000 | 0.515834 | 18.3770 |
| 1 | 15110047 | 0.513963 | 0.00187099 | 18.5184 | 15110050 | 0.00277991 | 0.513054 | 18.5917 |
| 2 | 15110051 | 0.515108 | 0.000725985 | 17.9335 | 15110049 | 0.00322819 | 0.512606 | 18.3553 |