| Red | Green | Blue | |
| z | 17.64 | ||
| znorm | Inf | ||
| sky | -Inf | -Inf | -Inf |
| S/N | 22.1 | 41.3 | 41.7 |
| S/N(c) | 0.0 | 0.0 | 0.0 |
| SN(E/C) |
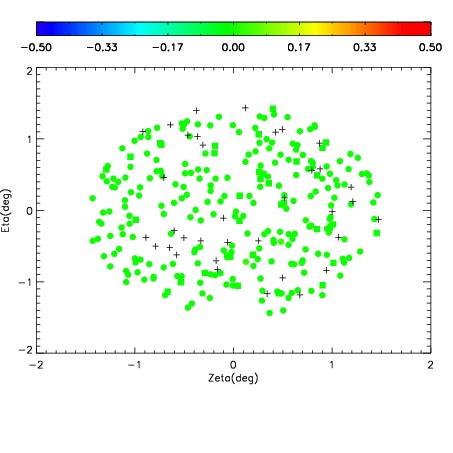
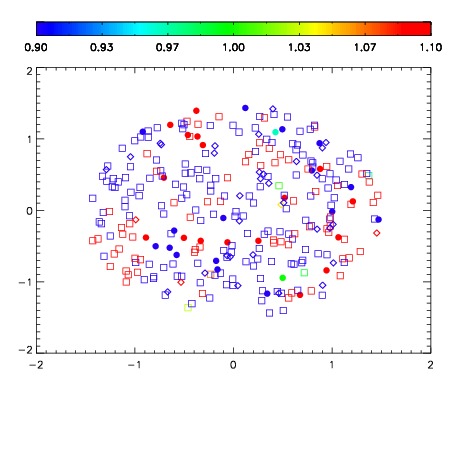
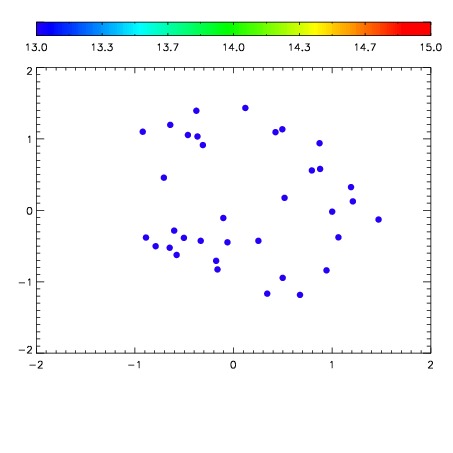

| Frame | Nreads | Zeropoints | Mag plots | Spatial mag deviation | Spatial sky 16325A emission deviations (filled: sky, open: star) | Spatial sky continuum emission | Spatial sky telluric CO2 absorption deviations (filled: H < 10) | |||||||||||||||||||||||
| 0 | 0 |
|
|
|
|
|
|
| IPAIR | NAME | SHIFT | NEWSHIFT | S/N | NAME | SHIFT | NEWSHIFT | S/N |
| 0 | 15170051 | 0.511967 | 0.00000 | 17.3571 | 15170052 | 0.00393891 | 0.508028 | 16.6430 |
| 1 | 15170032 | 0.507369 | 0.00459802 | 18.2929 | 15170031 | 0.00000 | 0.511967 | 18.5901 |
| 2 | 15170037 | 0.507461 | 0.00450599 | 18.2333 | 15170038 | 0.000810299 | 0.511157 | 18.3235 |
| 3 | 15170033 | 0.507989 | 0.00397801 | 18.1803 | 15170034 | 0.00149658 | 0.510470 | 18.3154 |
| 4 | 15170050 | 0.509994 | 0.00197303 | 18.1579 | 15170035 | 0.00106205 | 0.510905 | 18.1240 |
| 5 | 15170054 | 0.511909 | 5.79953e-05 | 18.1181 | 15170049 | 0.00280551 | 0.509161 | 18.0769 |
| 6 | 15170036 | 0.507251 | 0.00471598 | 18.0227 | 15170048 | 0.00286762 | 0.509099 | 17.9105 |
| 7 | 15170047 | 0.509905 | 0.00206202 | 17.9762 | 15170053 | 0.00397903 | 0.507988 | 17.8451 |